|
|
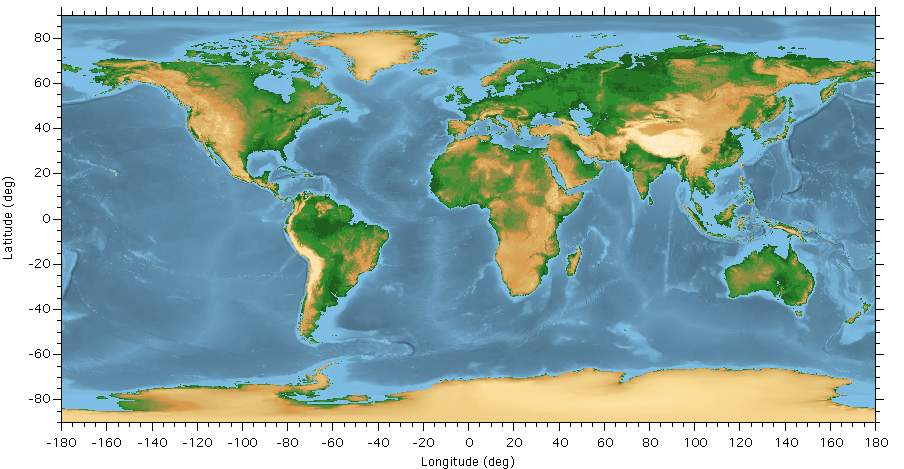
| Global Topography and Bathymetry |
Igor Pro includes a variety of custom and general tools for importing, displaying, and analyzing geospatial data.
- Import common GIS data formats.
- Write some common GIS data formats.
- Transform data between spatial reference systems.
- Display data in 1D, 2D, and 3D graphs.
- Analyze data using built-in and custom operations, functions, and procedures.
With Igor Pro you can work with standard geospatial data formats such as Shapefile and GeoTiff.
Igor imports both raster and vector GIS data. Raster data sets are arrays of gridded data points. These formats often represent 2D surfaces such as land topography or undersea bathymetry.
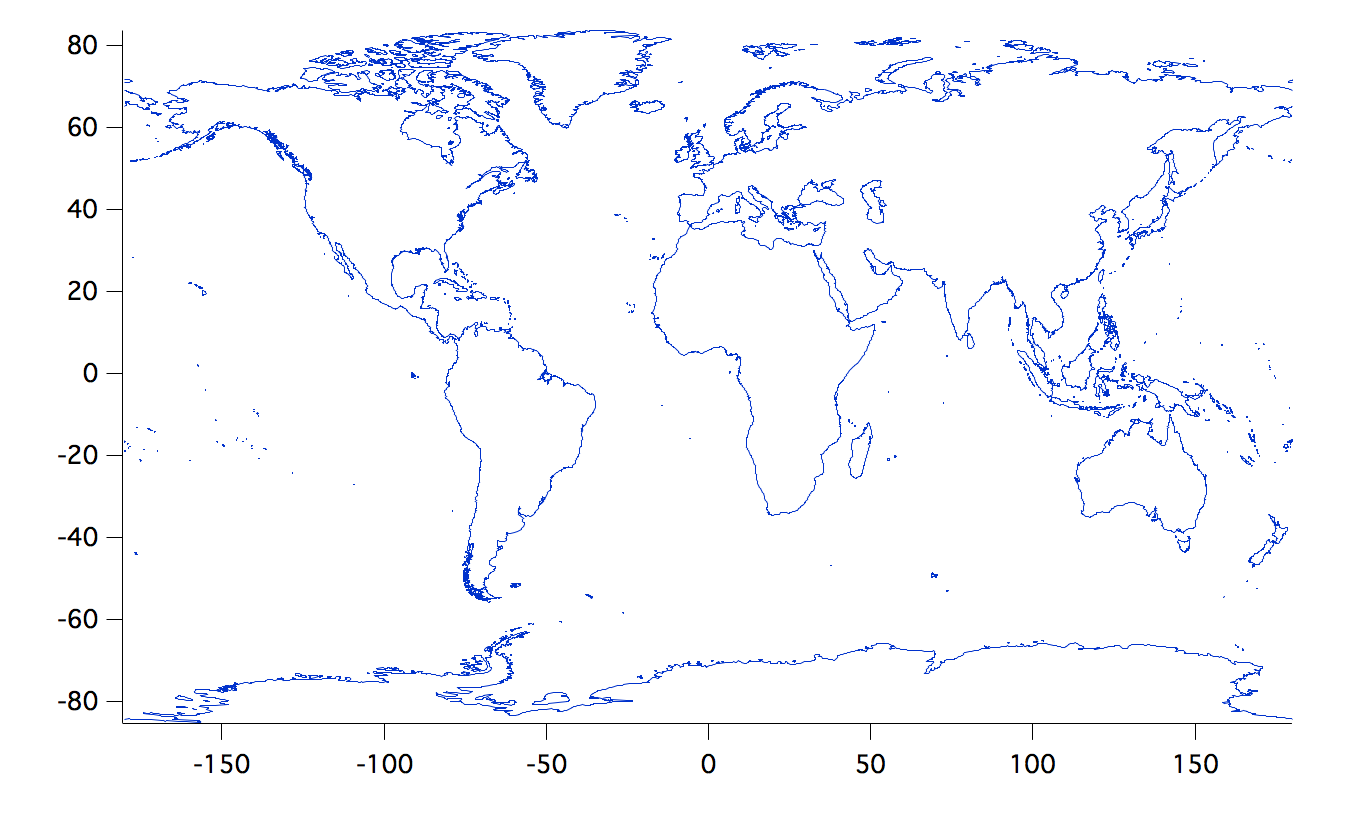
Vector data sets represent spatial objects as collections of points, lines and polygons. Vector data is well suited to representing spatial data as geographic boundaries. Examples include shorelines, rivers, roads, political divisions, and vessel paths. Vector data sets often contain additional non-spatial data such as name, population, or wikipedia URLs.
IgorGIS XOP
The new Igor GIS XOP greatly increases the number of readable formats, provides access to feature data in vector files, and handles spatial transformations of both vector and raster data using widely used spatial reference specifications.
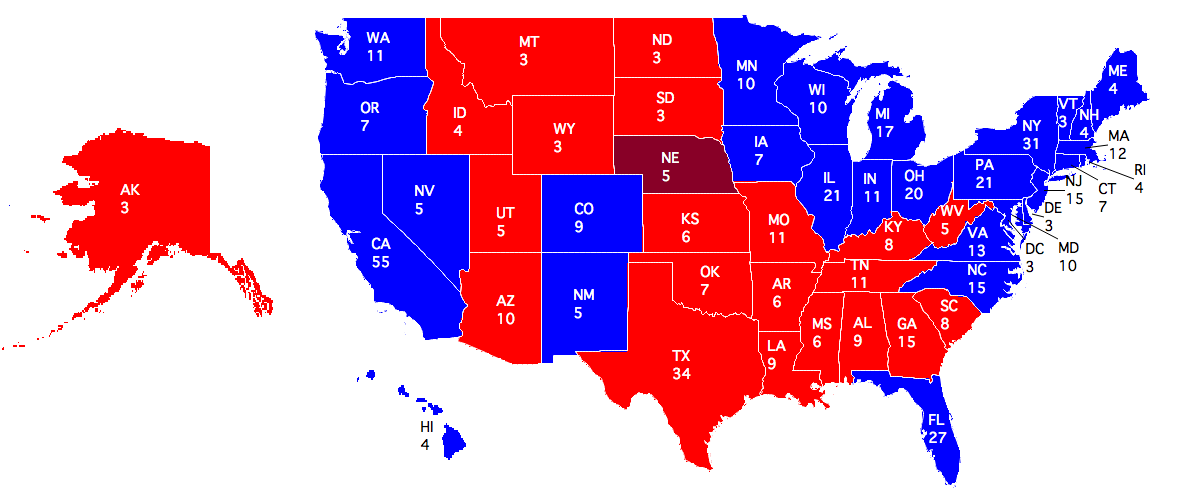
With the IgorGIS package comes IgorGIS Procedures.ipf, a set of Igor functions making it easier to produce custom maps with GIS data. You can, for example, load a vector map of the United States, generate a fill image, color the states according to presidential election results, move Alaska and Hawaii to just west of California, and display state codes and electoral college votes on top of each state. As another example you can load vector maps of the countries of the world and of the world's cities, filter for cities tagged as "World Cities" by the data set, then plot those cities with circle size scaled to population and taged the city names.
|
|
| USA Presidential Election 2008 Electoral College Results |
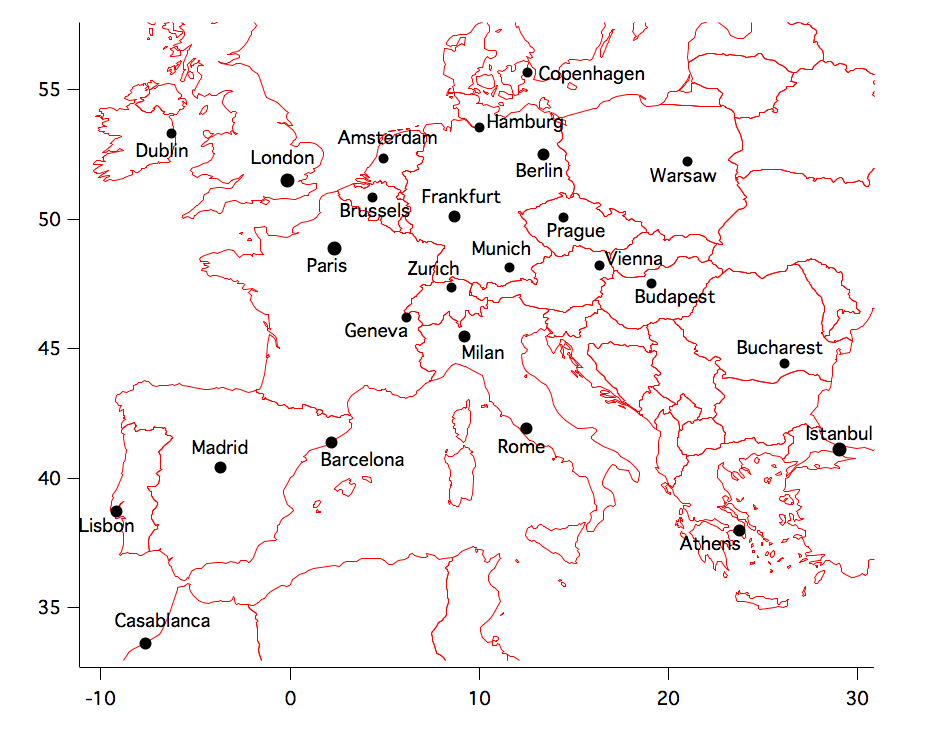 |
| Select European and Surrounding Cities |
Beginning with Igor 6.37 the IgorGIS XOP comes with Igor. You do have to activate it. See the "Activating the IgorGIS Package" help topic within Igor for instructions on activating IgorGIS. Simply type 'DisplayHelpTopic "Activating the IgorGIS Package"' into your Igor command window. A detailed IgorGIS tutorial can also be found within the IgorGIS Help.ihf file.
Sample Datasets
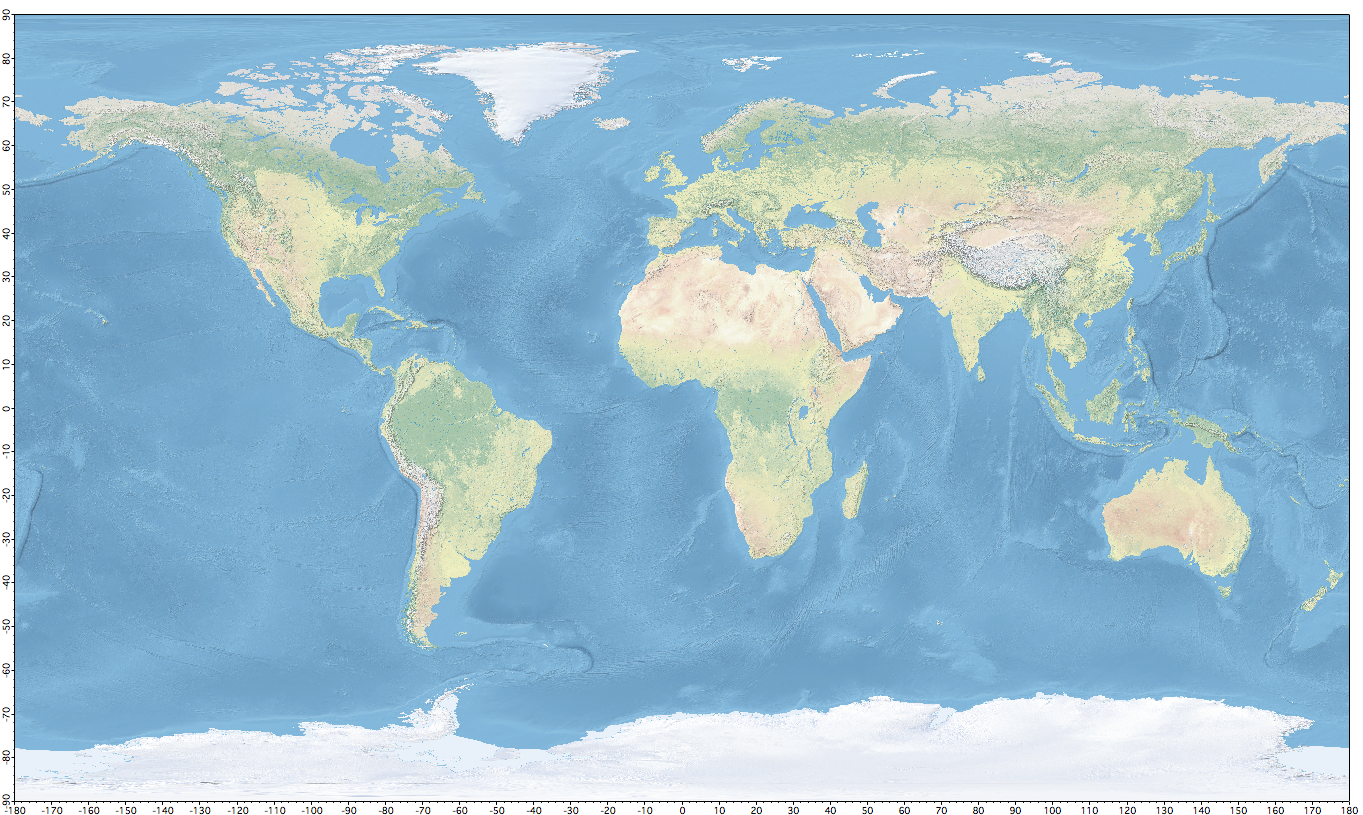
To facilitate users generating common geographical maps we have imported some public domain GIS data into Igor experiments and made those experiments available for free download. These datasets include global coastline, global cities, global country boundaries, global state and province boundaries, and a global topography relief raster. See Igor GIS data.
|
|
|
| Global Coastline | Global Relief |
Examples and Demos
Included with the Igor Pro installation are a number of example and demo files that will help you to get started with displaying and analyzing geospatial data. The GIS Utilities procedures include a comprehensive help file describing the various utilities and listing a wide variety of online repositories from which you can obtain data. The Half Dome Demo experiment file provides an introduction to the GISLoadWave XOP with an example of data import from a USGS SDTS DEM and DLG. The Map Projections Demo experiment file provides several examples demonstrating aspects of the built-in Project operation.
Igor Pro also comes with demo experiments that demonstrate some of the basic geospatial display capabilities to help you get started.
|
|
|
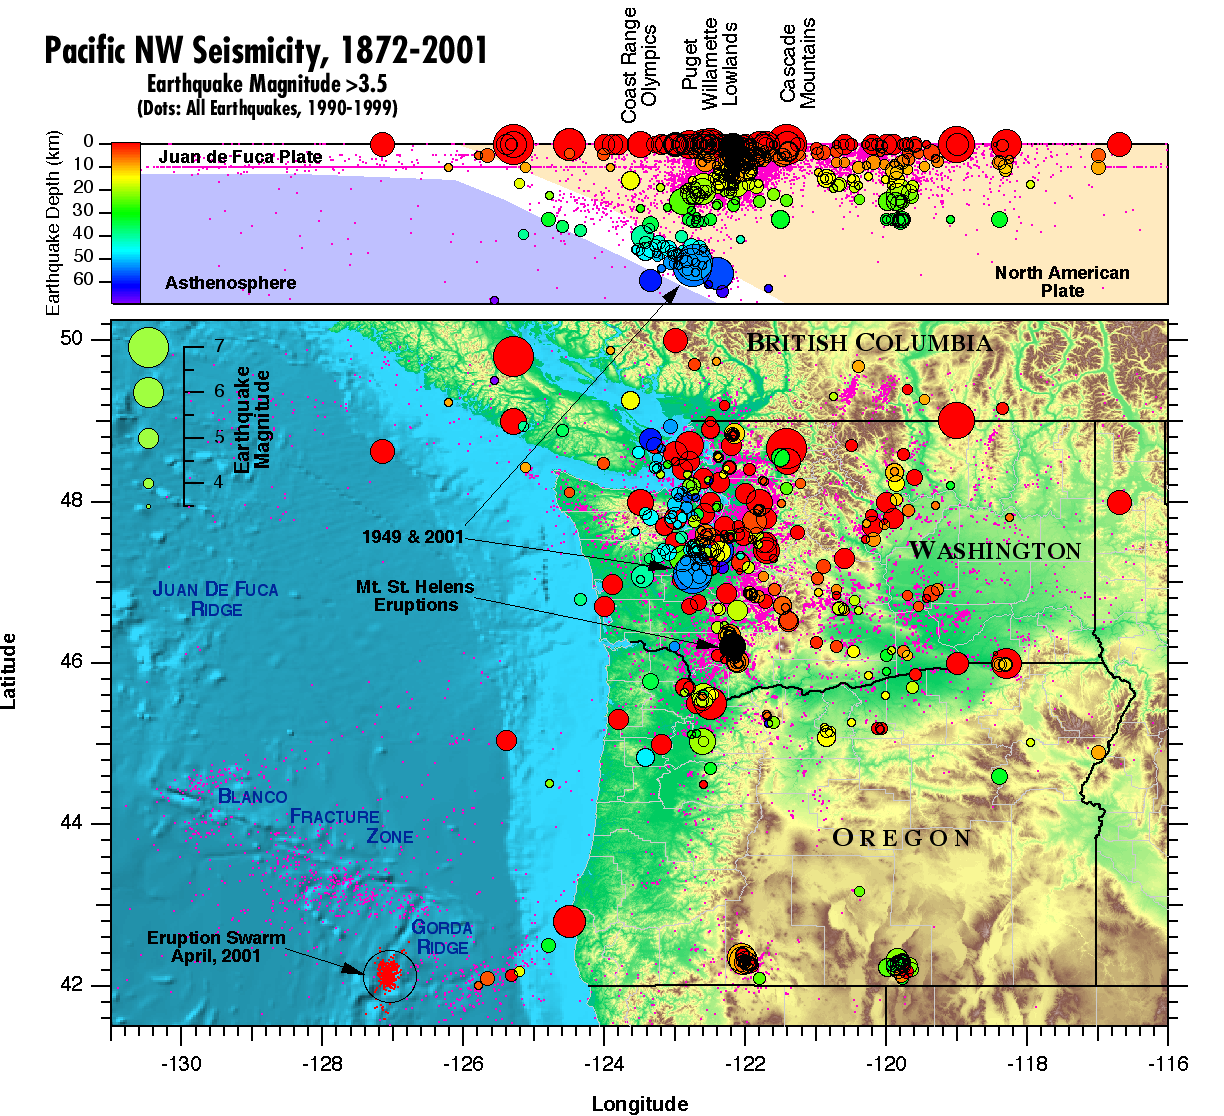
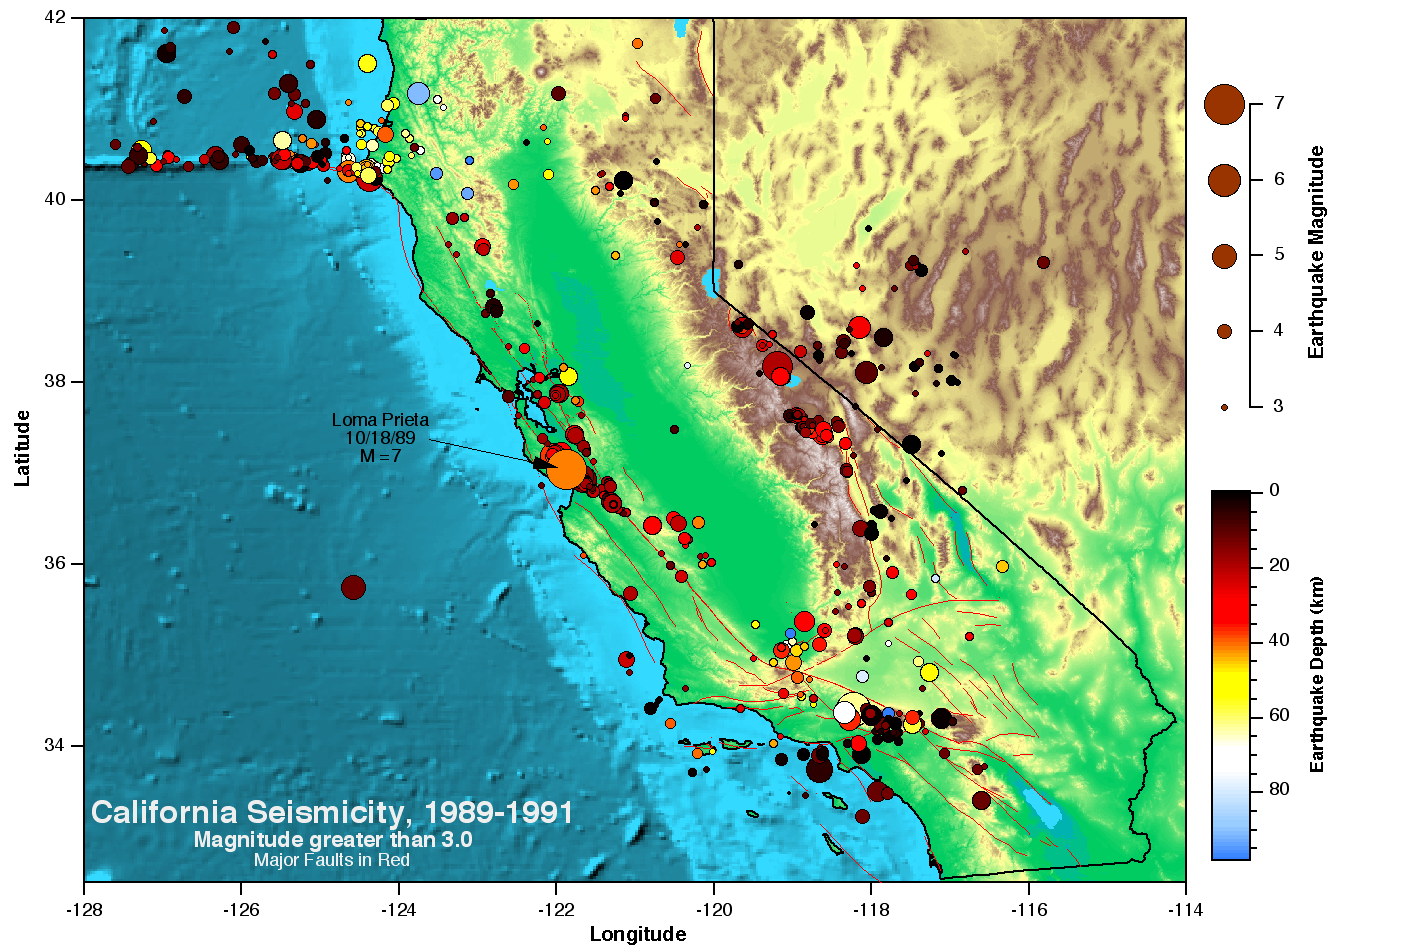
| US Pacific NW Earthquakes and Crustal Profile | California Earthquakes and Major Faults |
Data Formats
Igor Pro GIS support includes specialized utilities for importing most open source geospatial data formats. The following table lists the readable GIS data formats. Note that the number of readable GIS formats has been greatly expanded with the introduction of the new IgorGIS XOP, with that expansion including the ubiquitous Shapefile and GeoTiff formats.
| Raster Formats | Vector/Line Formats |
|
|
Besides the custom data loaders that will import data in the listed formats, you can import a variety of simple geospatial data types using Igor Pro's various general-purpose text and binary data import operations.
Data Display and Analysis
|
|
| Monterey Submarine Canyon Profile |
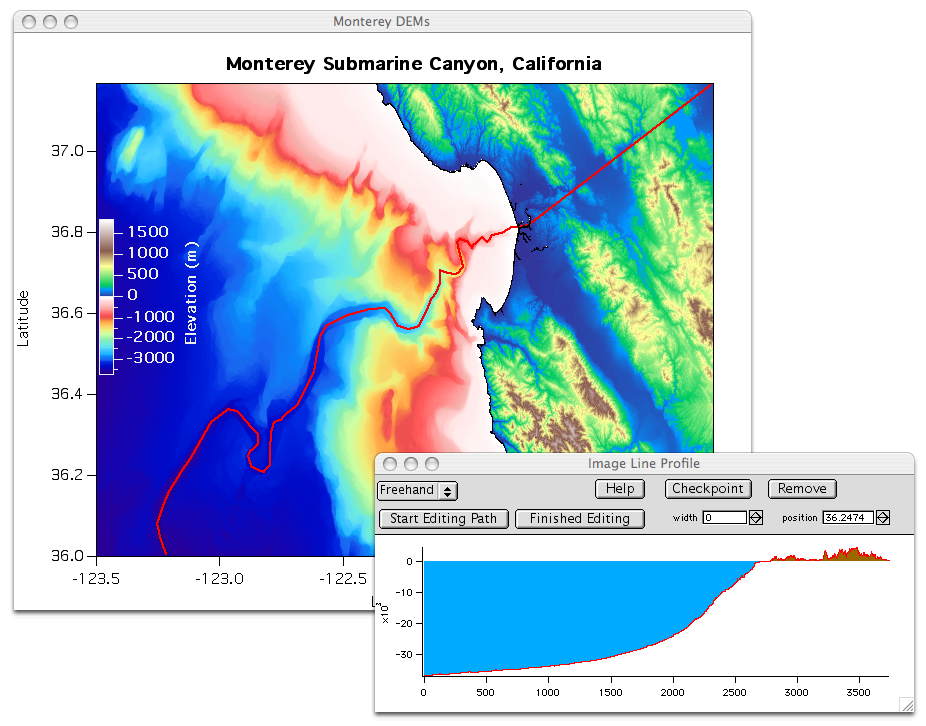
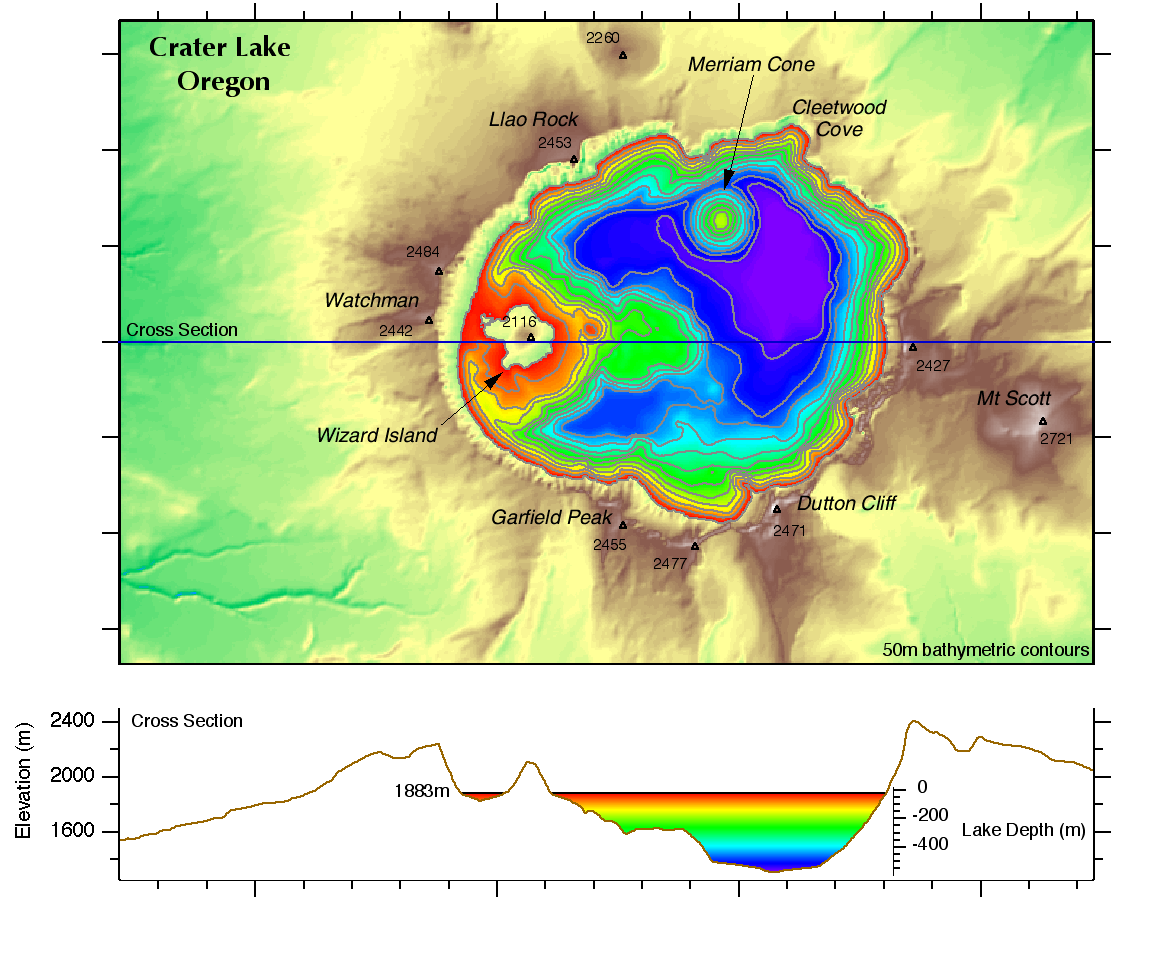
In addition to the specialized geospatial data import and analysis tools, Igor Pro includes a variety of built-in operations that may be useful for displaying and analyzing geospatial data. Most useful may be some of the image analysis operations, such as ImageLineProfile and ImageTransform. For examples of how ImageLineProfile might be used, the image above shows the creation of a profile for the Monterey Canyon and the image below shows a finished and greatly modified profile of Crater Lake.
|
|
| Bathymetry of Crater Lake, Oregon |
You can create contour plots of 2D raster data sets or project vector data using various standard map projections (orthographic, stereographic, gnomonic, general perspective, Lambert equal area, equidistant, Mercator, transverse Mercator, and Albers equal area). Using the IgorGIS XOP you can project raster or vector data to/from any spatial reference expressed in OGC Well Known Text. The Spatial Reference website provides thousands of spatial references, all available in OGC Well Known Text.
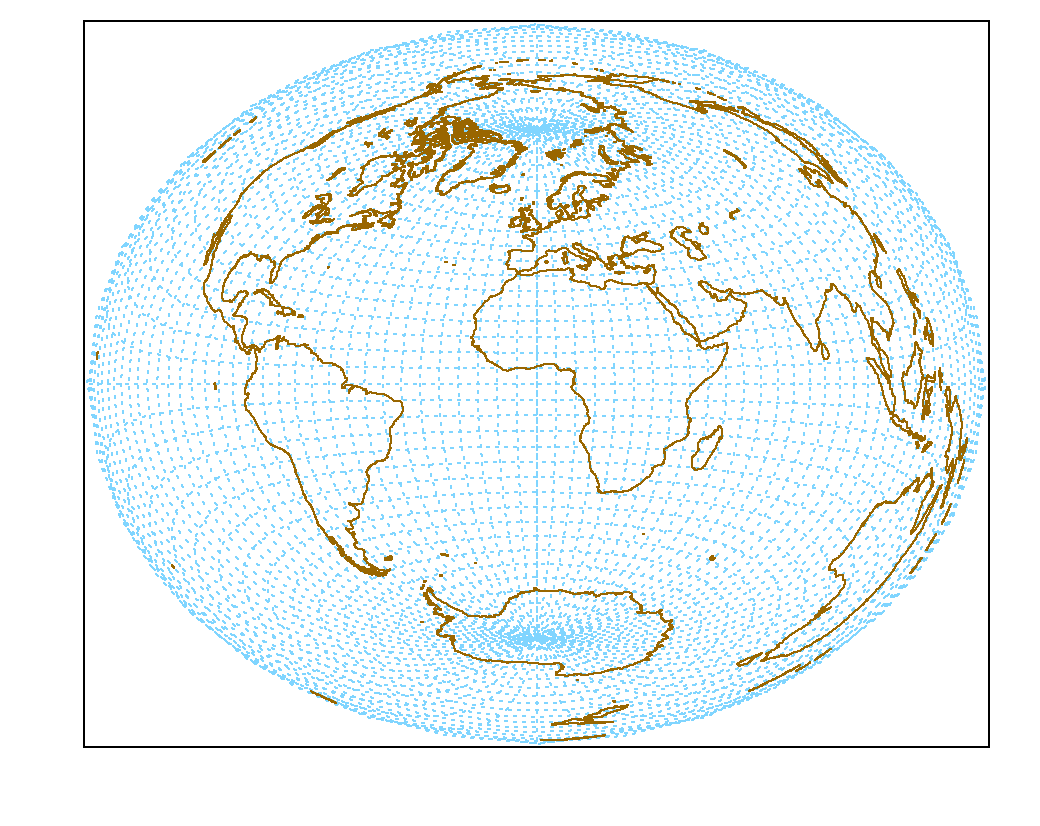 |
| Lambert World Projection |
You can display vector data as you would any other XY data set. In Igor Pro graphs you have control over the line width, color, patterns, etc. You can display 2D DEM data with all of the flexibility you have with normal 2D graphs.
With the Gizmo visualization tool you can construct 3D models of your DEM data to show perspective views with contours, lighting, shading, and texture maps. Two examples of the Mt. St. Helens volcano in Washington state are included in our samples gallery. One is a perspective view of earthquakes beneath the volcano and another is an animation of the volcano before and after it's 1980 eruption.

Forum

Support

Gallery
Igor Pro 10
Learn More
Igor XOP Toolkit
Learn More
Igor NIDAQ Tools MX
Learn More