Volumetric data usually refers to a 3D distribution of scalar values. For example, CAT scans result in 3D scalar distribution of the optical (X-Ray) density of tissue, MRI scans result in 3D scalar distribution proportional to tissue density (computed from relaxation times of hydrogen nuclei).
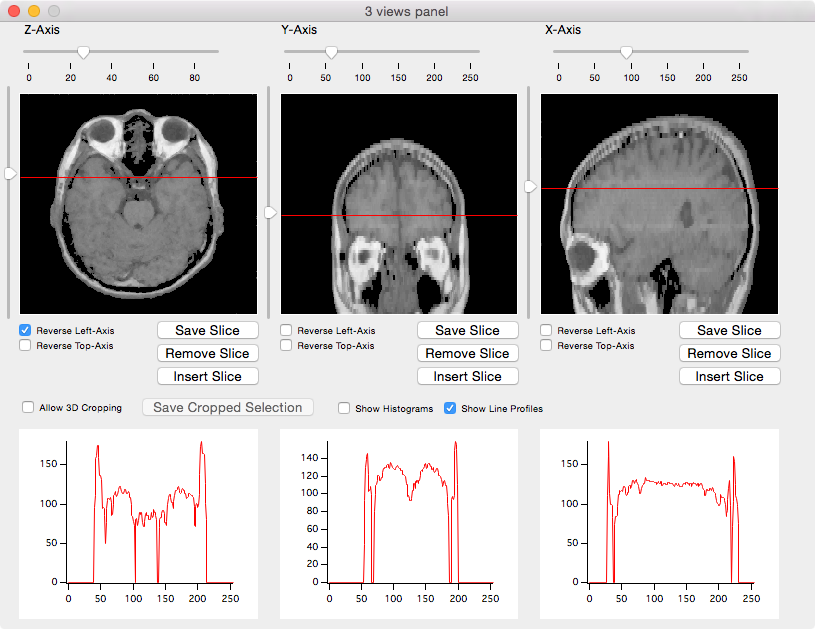
You can visualize 3D scalar distributions using various tools. The 3D Wave Display procedures allows you to independently scan through slices perpendicular to the three axes. The following example shows 3 orthogonal planes through human brain MRI.
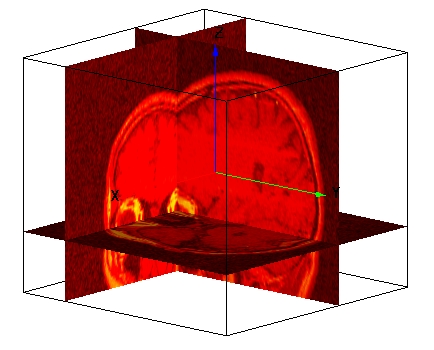
Gizmo is a powerful tool for displaying volumetric data. You can use Gizmo to display any number of orthogonal slices through the data. For example, the figure below consists of three slices from brain MRI.
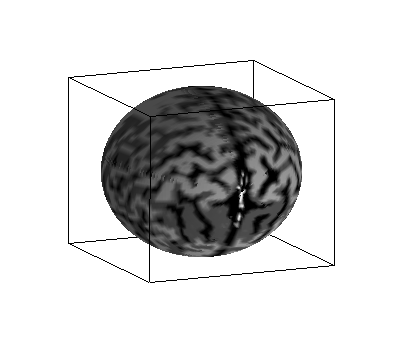
One can create almost arbitrary representations and sampling of volumetric data using built-in features such as isosurfaces, voxelgrams or by displaying parametric surfaces. For example, in the figure below we show a spherical "slice" through the same MRI data. The sphere was centered approximately at the center of the data array.

Forum

Support

Gallery
Igor Pro 9
Learn More
Igor XOP Toolkit
Learn More
Igor NIDAQ Tools MX
Learn More