A column data manipulation


viralvector
Tue, 05/19/2015 - 03:27 pm
Hello all,
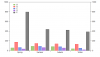
I would like to perform normalization from a column (time-lapse data in attached image). The column contains the baseline values (green rectangle) and experimental values (yellow rectangle). Then, baseline values will be averaged (showing in purple rectangle).
The ultimate goal is to obtain the normalized value (red rectangle) by taking the values (yellow rectangle) diving the averaged baseline (purple).
Can you give me an example (IGOR programing) to perform such task using IGOR?
Thanks!
Is your starting data just one column and are there always just two baseline values in row 4 and 5? If yes, then this may be a very easy task. If no, then you need first tell us more about how to tell baseline and experimental values apart.
Anyway, here's some simple code to average the two baseline rows and the dividing the rows after that by the average (untested, due to lack of real data):
wave mydata
Variable avgbase = (mydata[3]+mydata[4])/2
mydata[5,] /= avgbase
End
May 21, 2015 at 10:53 pm - Permalink
Hi Chozo,
The baseline values are always 4 and 5. The code worked. I will use this as template and modify it.
Thank you again.
May 25, 2015 at 08:51 am - Permalink