Igor Pro® can generate surface plots from a 2D matrix of values or from scatter data consisting of XYZ triplets.
Plotting a Surface from a 2D Matrix
Igor uses OpenGL based technology to display surfaces. In the examples below we show some of the more common surface plotting options.
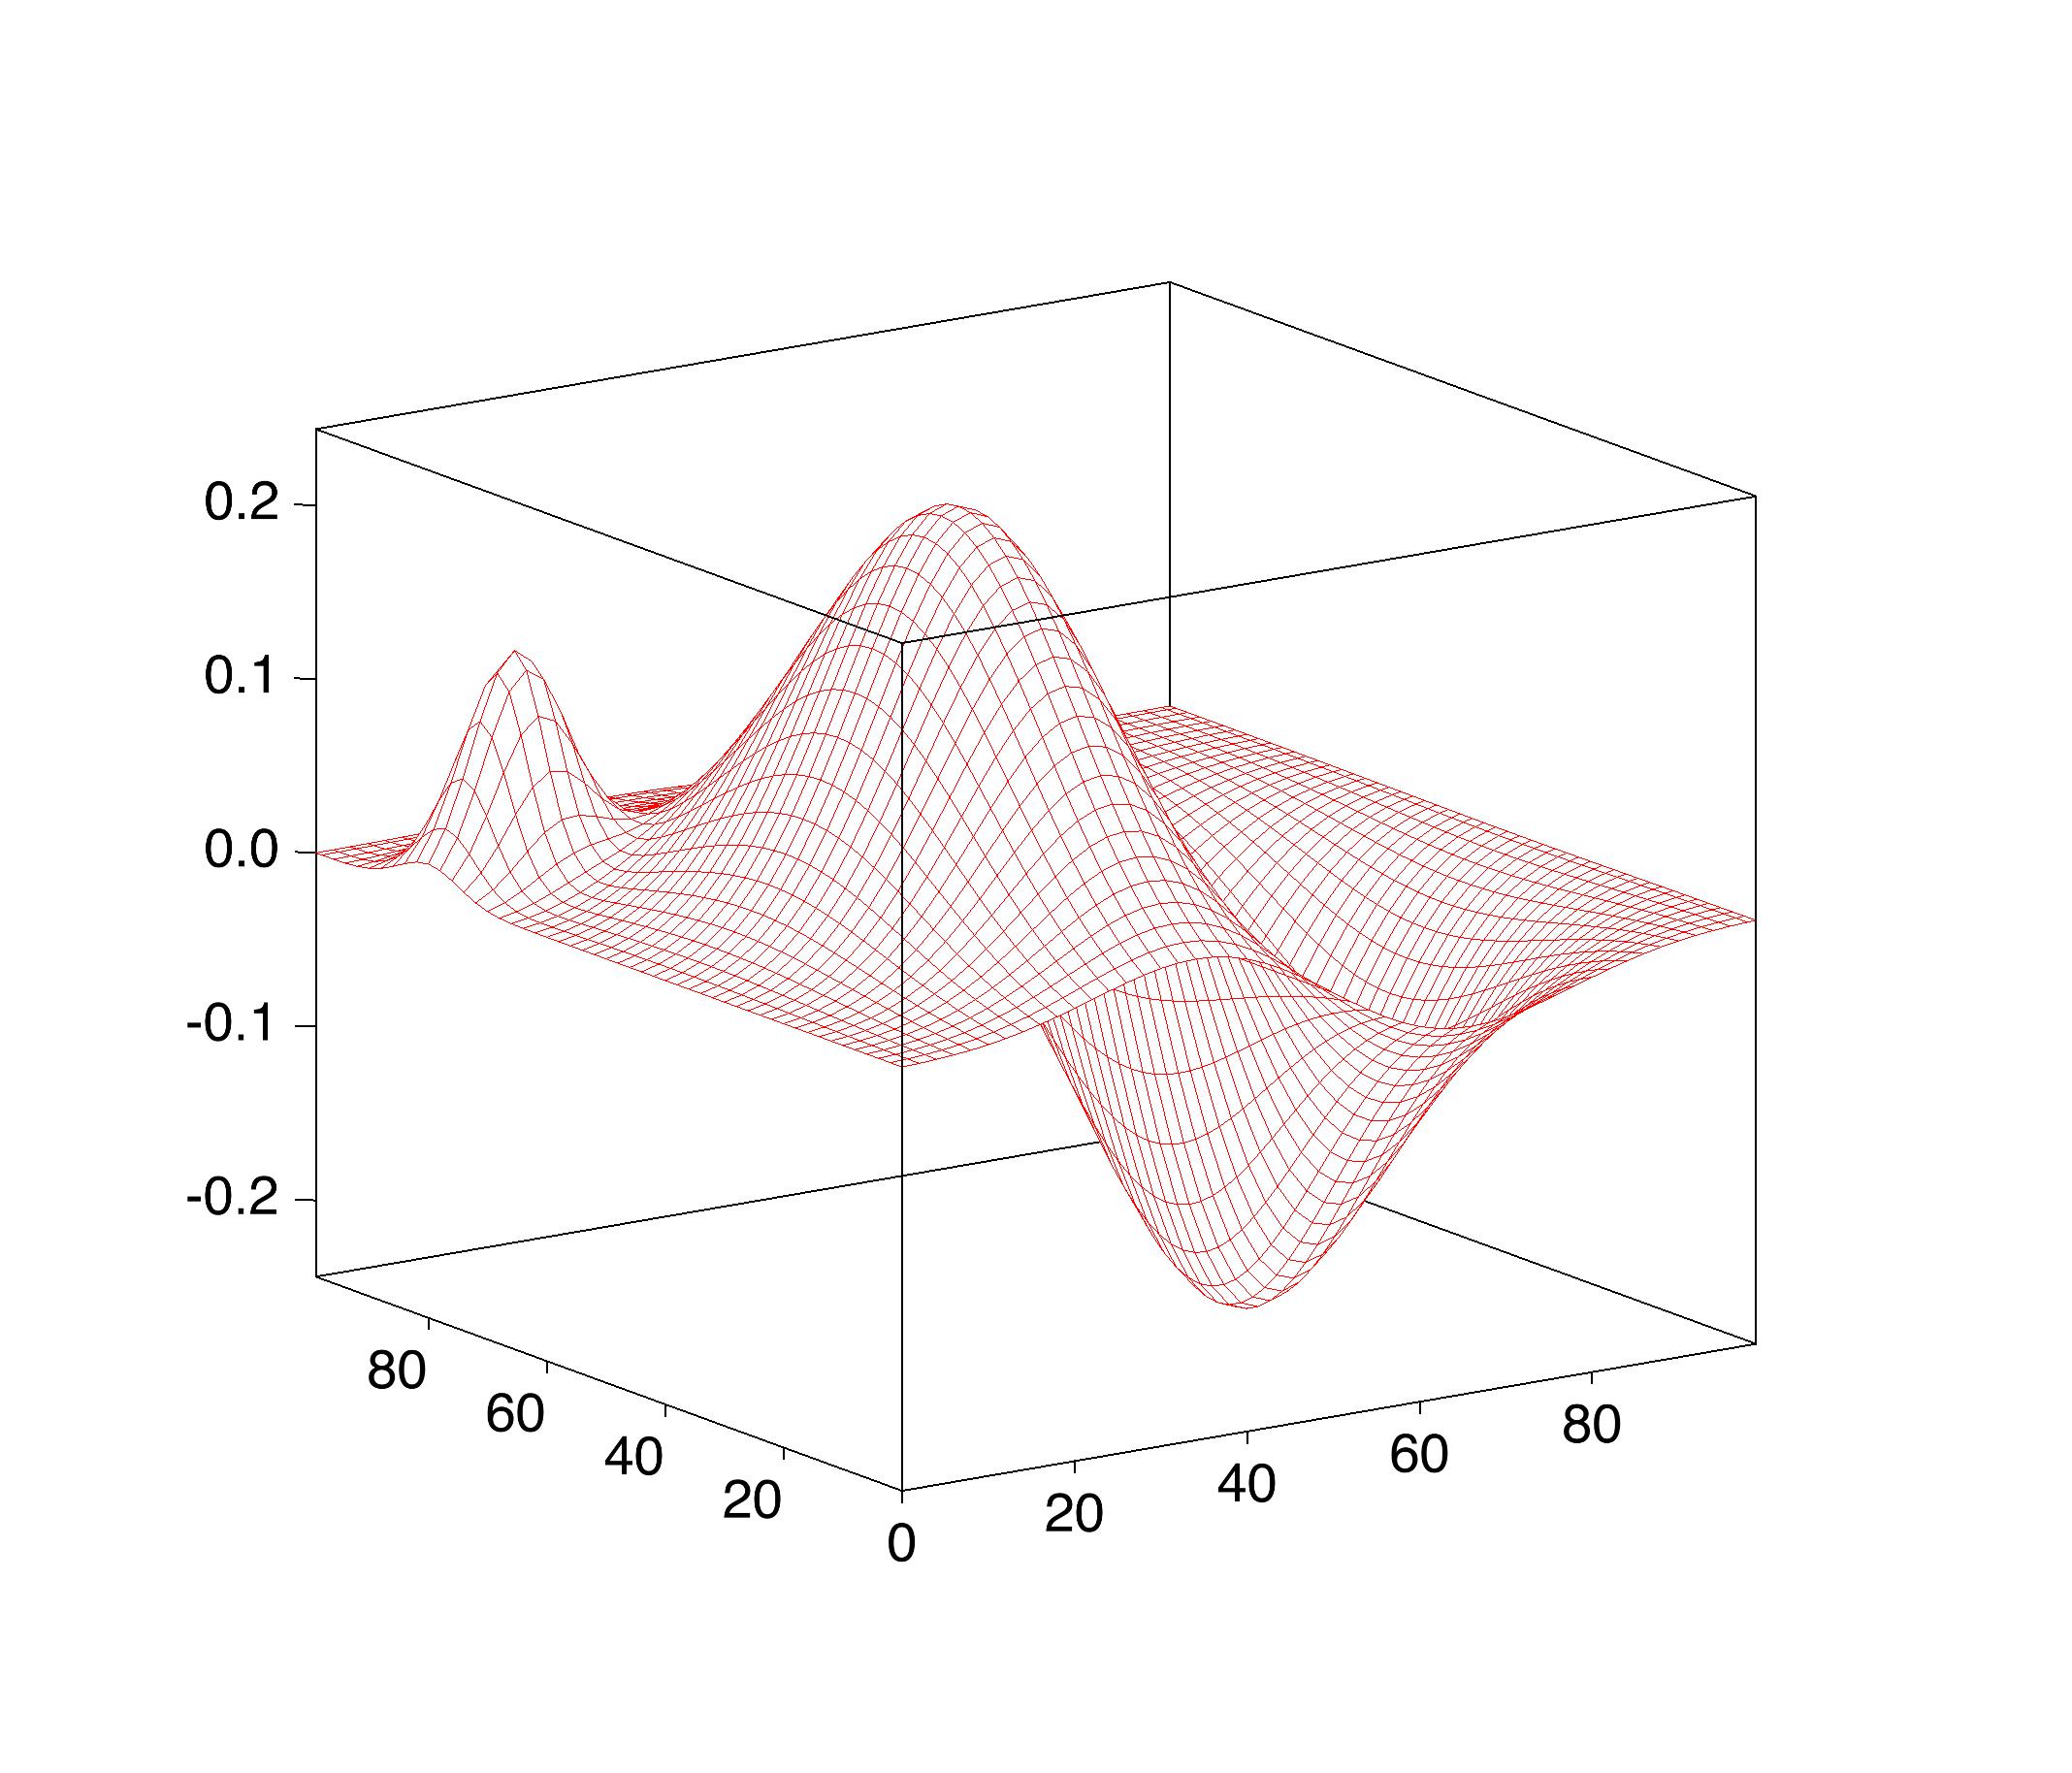
This is the simplest example of a mesh or wireframe surface on a white background. Historically, wireframe plots were popular because they were easier to compute and could be reproduced in black and white publications.

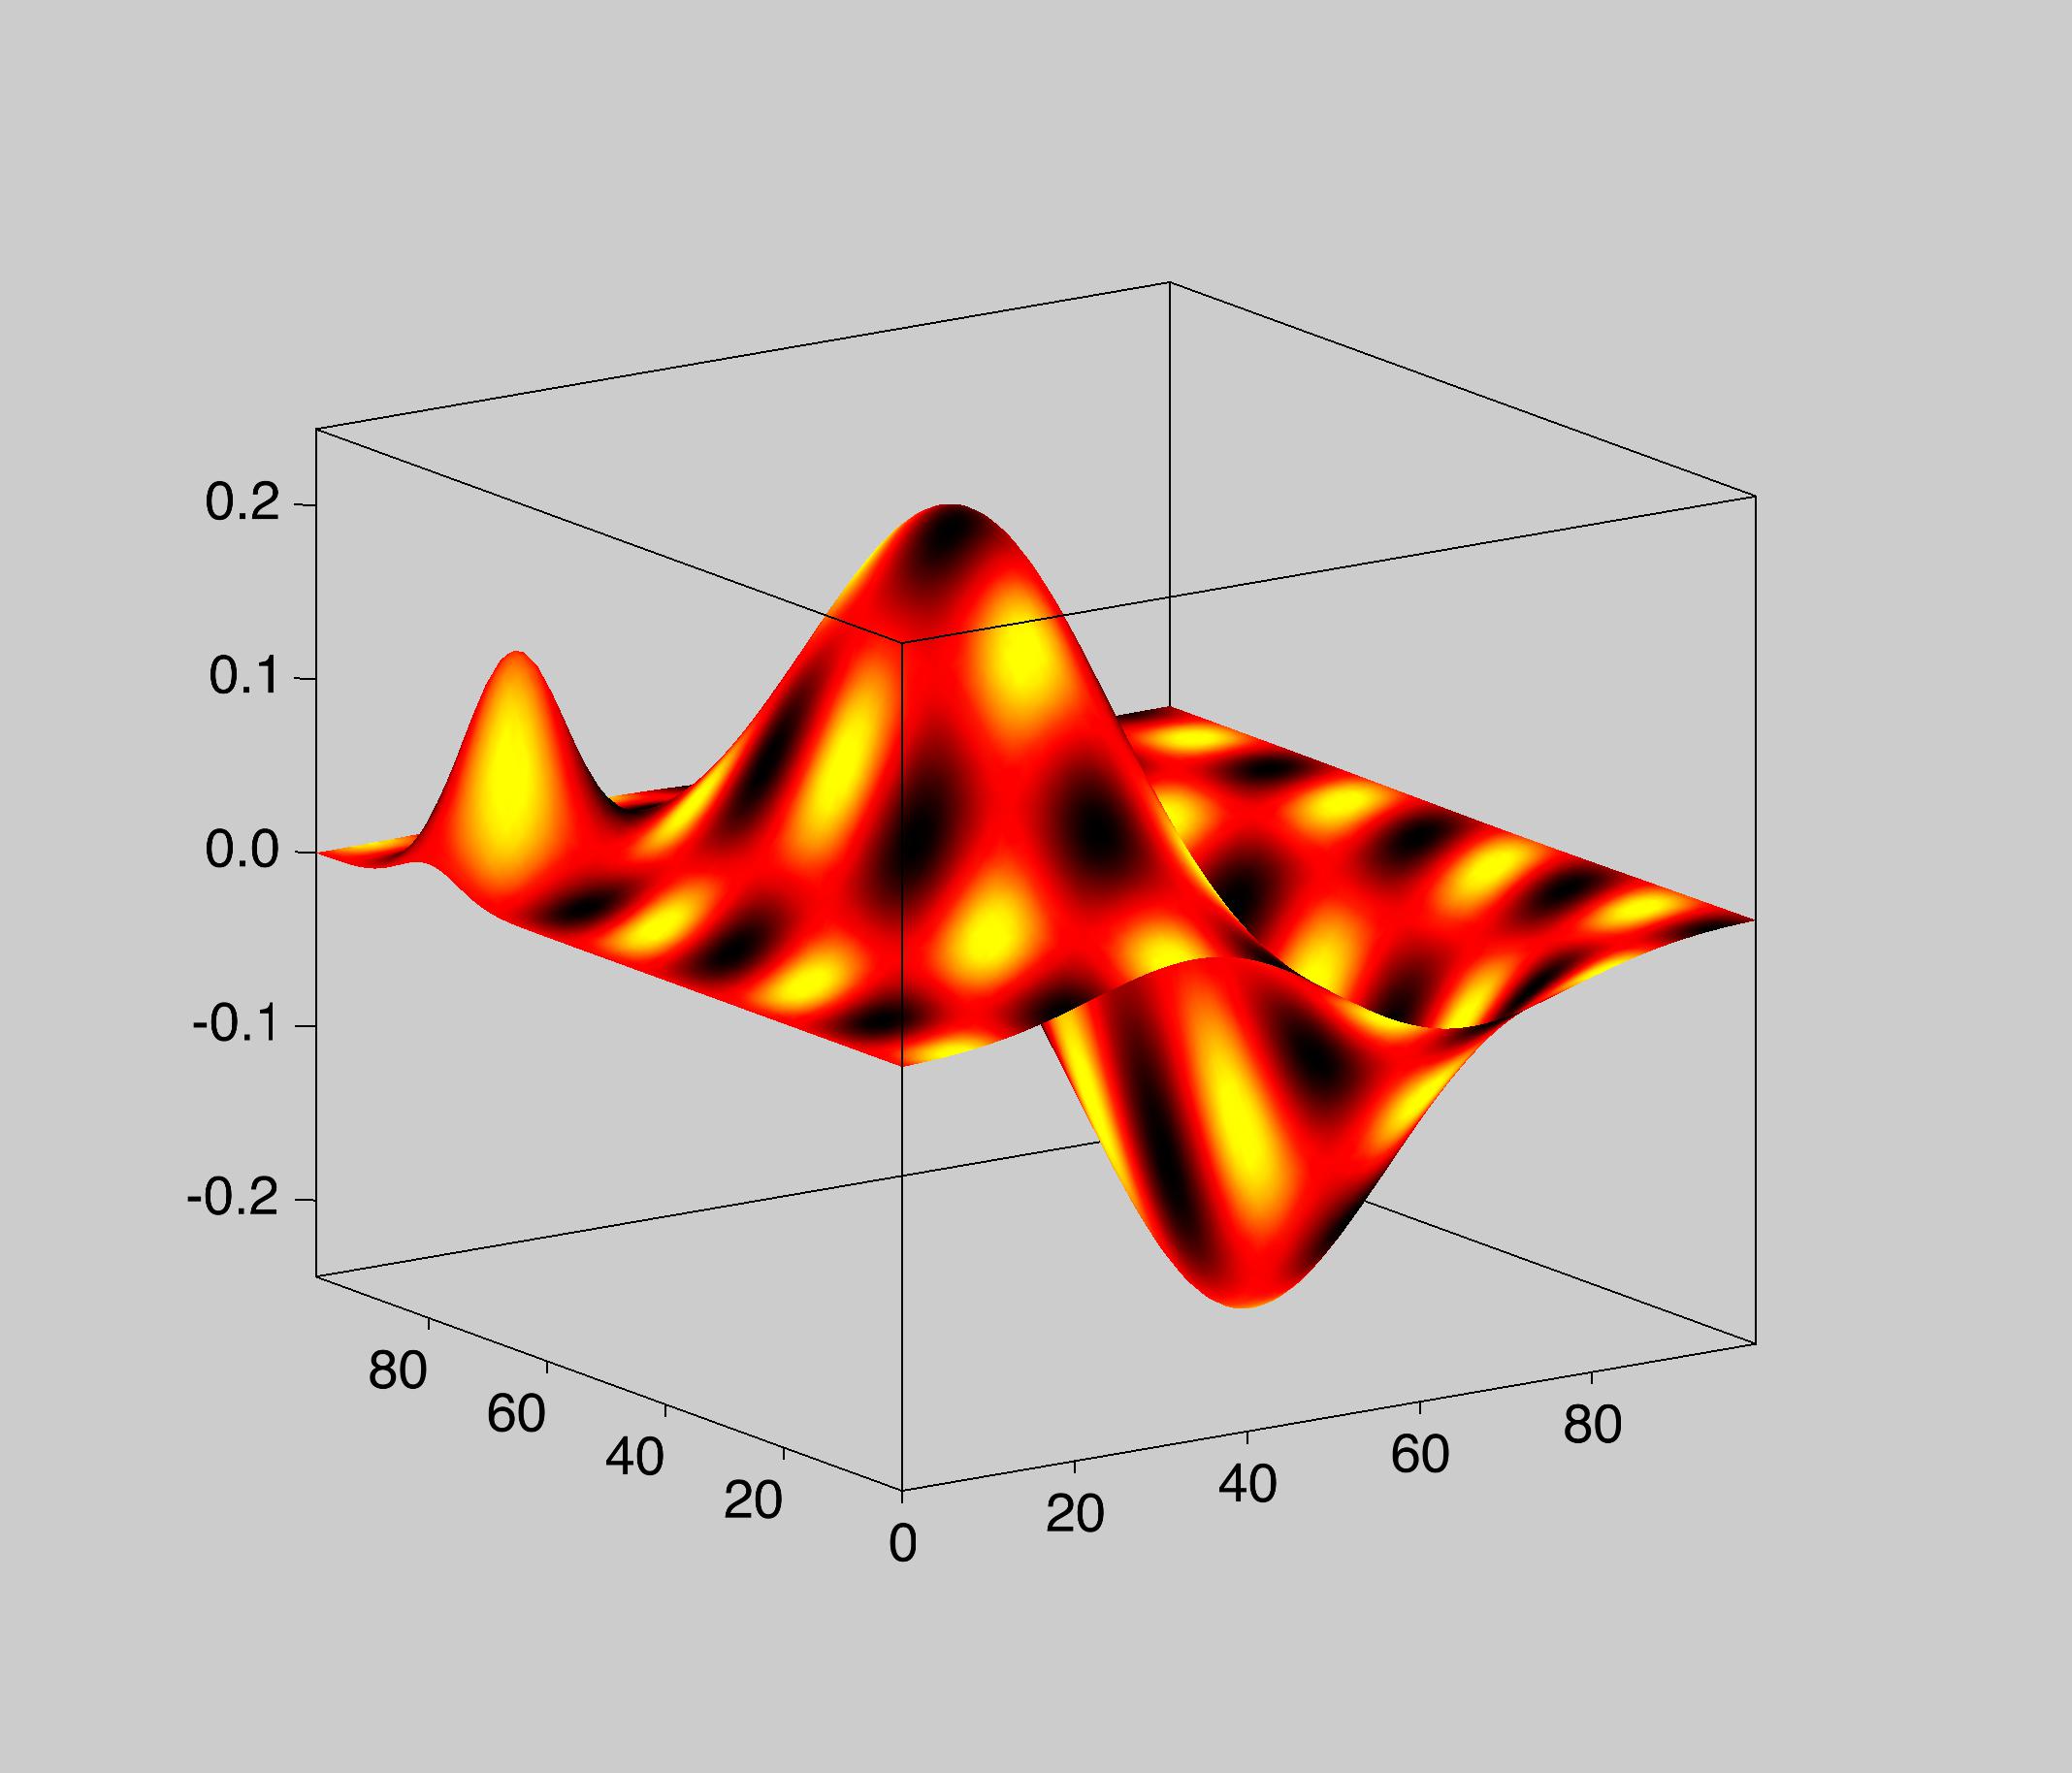
In this example the same data is plotted as a shaded and filled surface. The color of the surface is determined by mapping the Z-value into one of the built-in colortables. A contour map of the data is projected below the surface
In some situations you may want to display values from a scalar distribution on a 3D surface. You can do so by using choosing the color for each point on the surface from a scale representing the value of the scalar distribution at that location. The graph below shows an example where the scalar distribution is the product of sin(x/4)*cos(x/4).
Plotting a Surface from Scatter Data
There are two options for plotting a surface from scatter data:
1. Use interpolation techniques to convert the scatter data into a 2D matrix and then plot it using one of the methods shown above. You can find more on scatter interpolation here.
2. Plot a raw triangle surface derived from the triangulation of the data in the XY plane. You can obtain the triangulation information from a contour plot or from the ImageInterpolate operation.
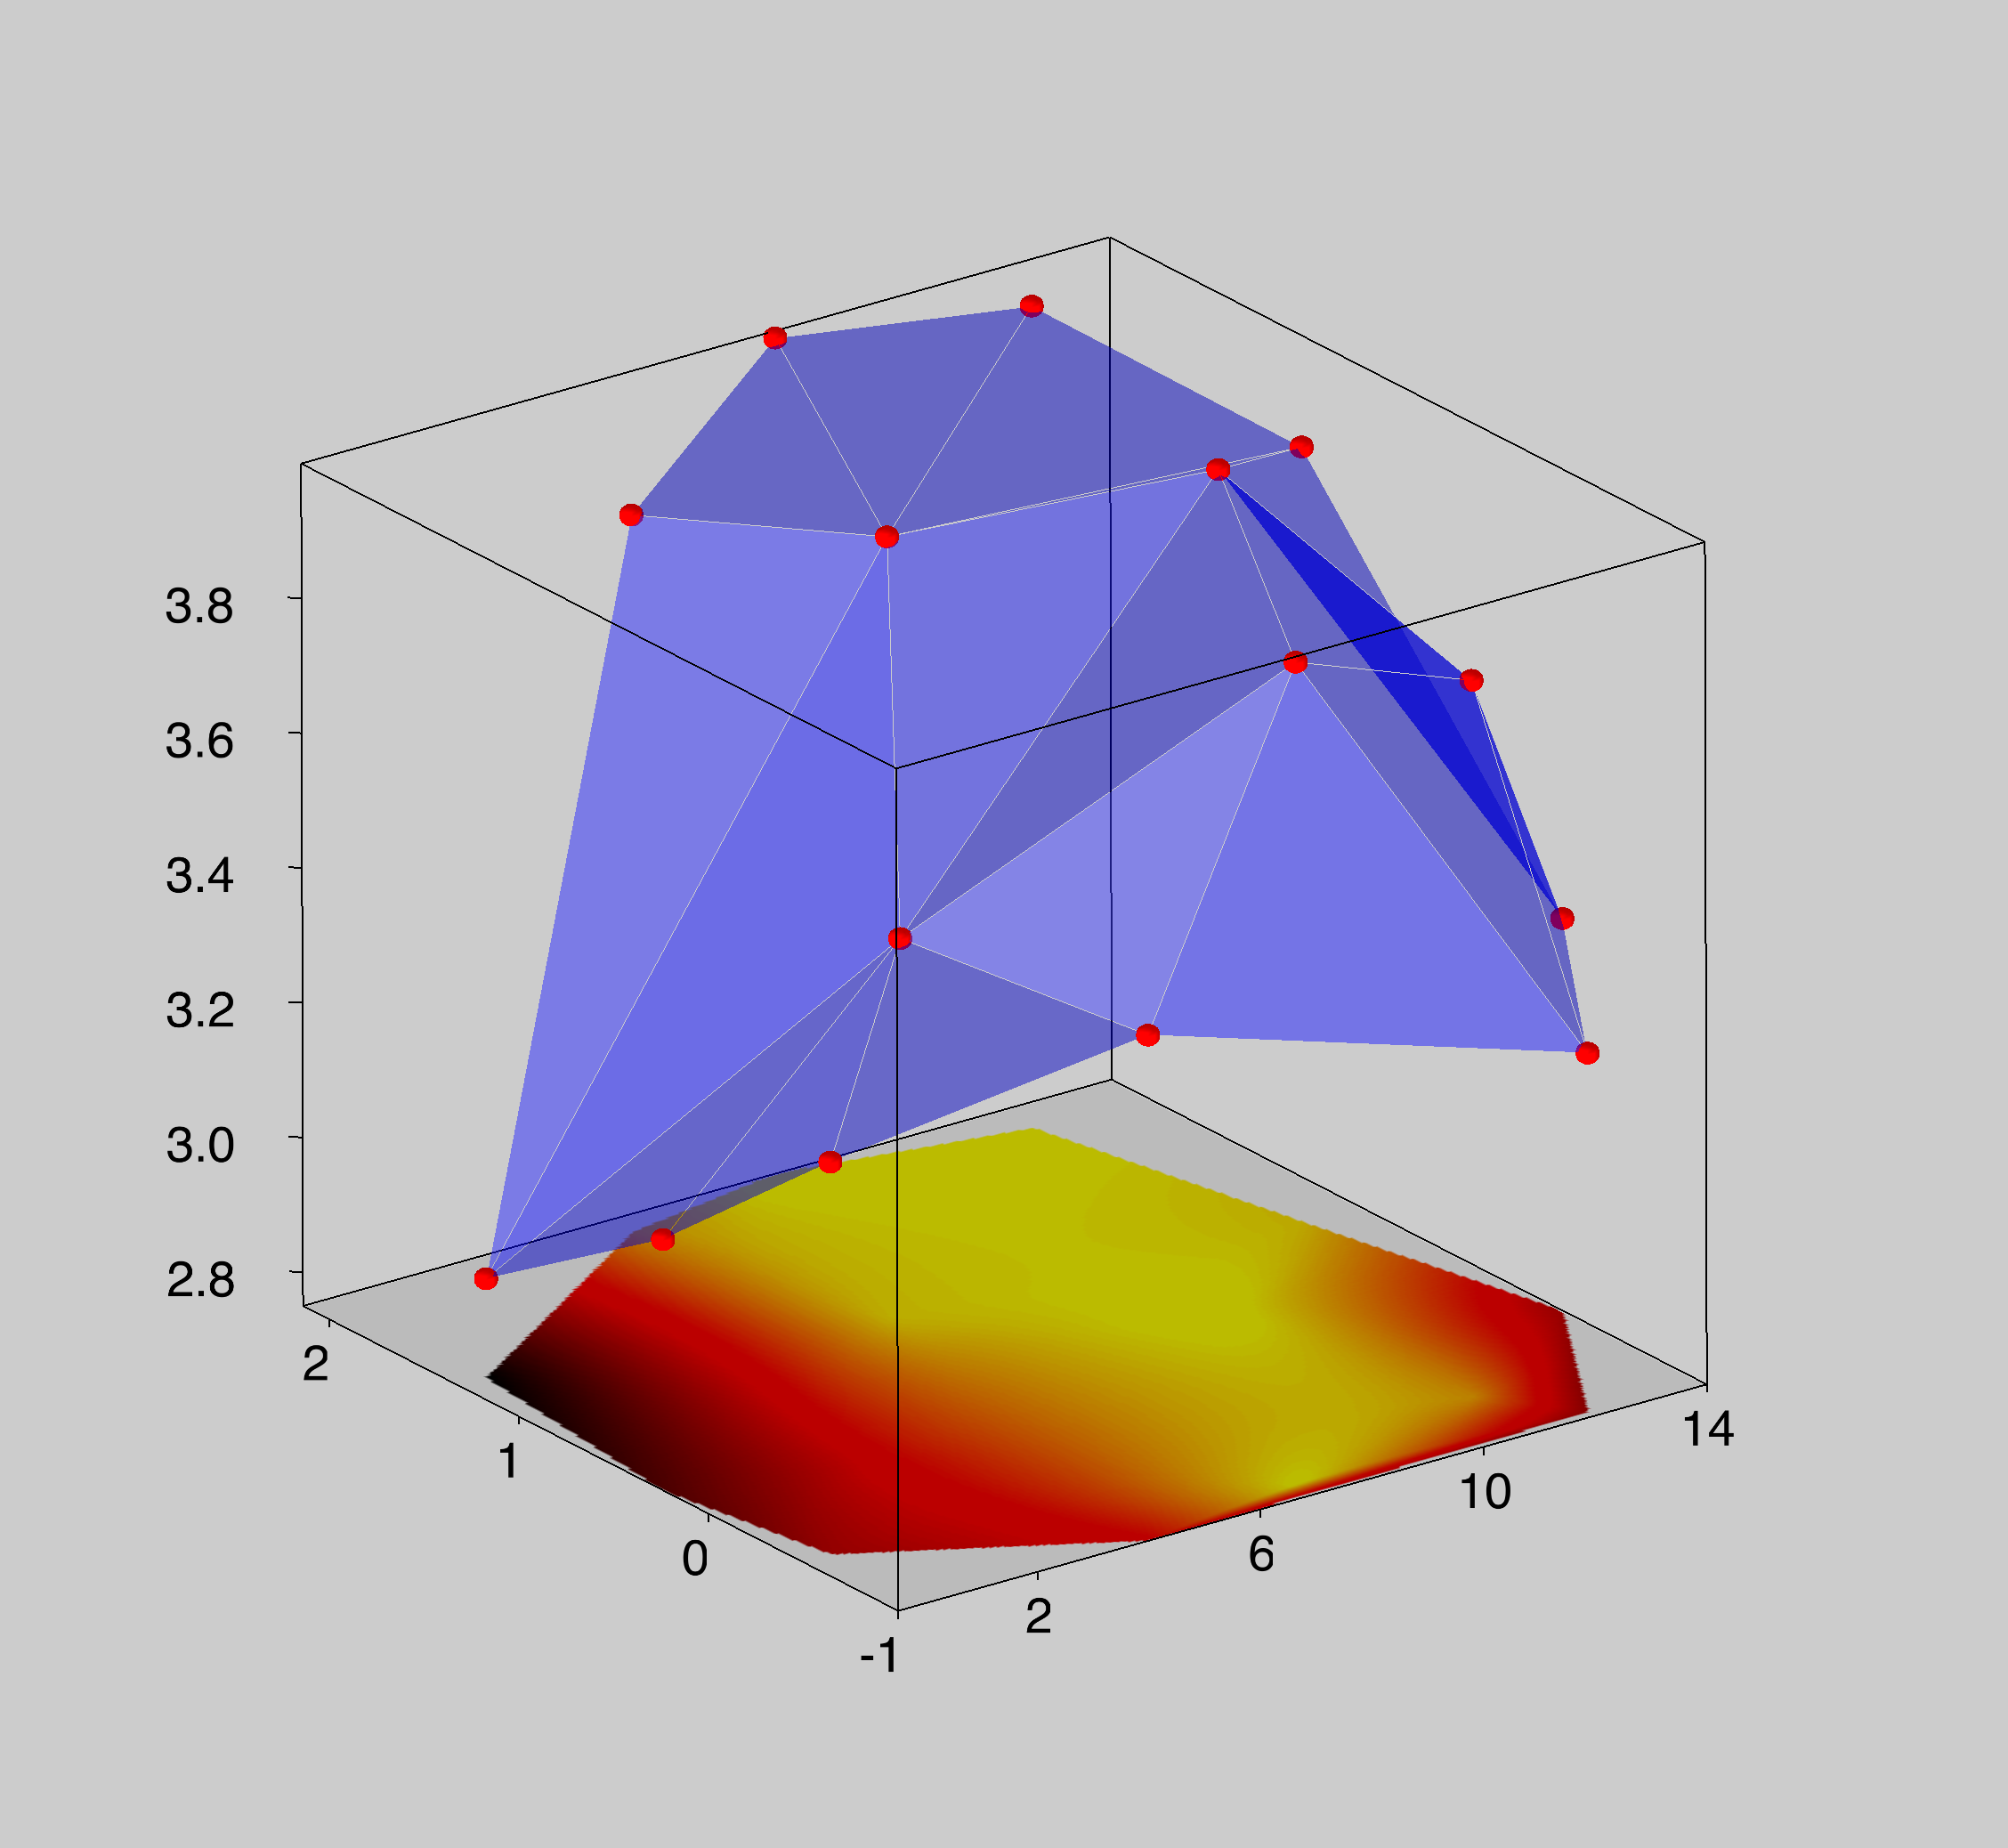
In this example the triangle surface is shown in shades of blue. Below the surface we plotted a false-color image of the same data obtained after interpolating it on a rectangular grid. The blank areas in the corners of the image correspond to portions of the interpolated matrix that are outside the convex domain defined by the data.
Plotting Intersecting Surfaces
Plotting intersecting surfaces is considerably more complicated because one usually wants to stress some data more than others. You can plot any combination of intersecting surfaces using Gizmo. Here are some examples.
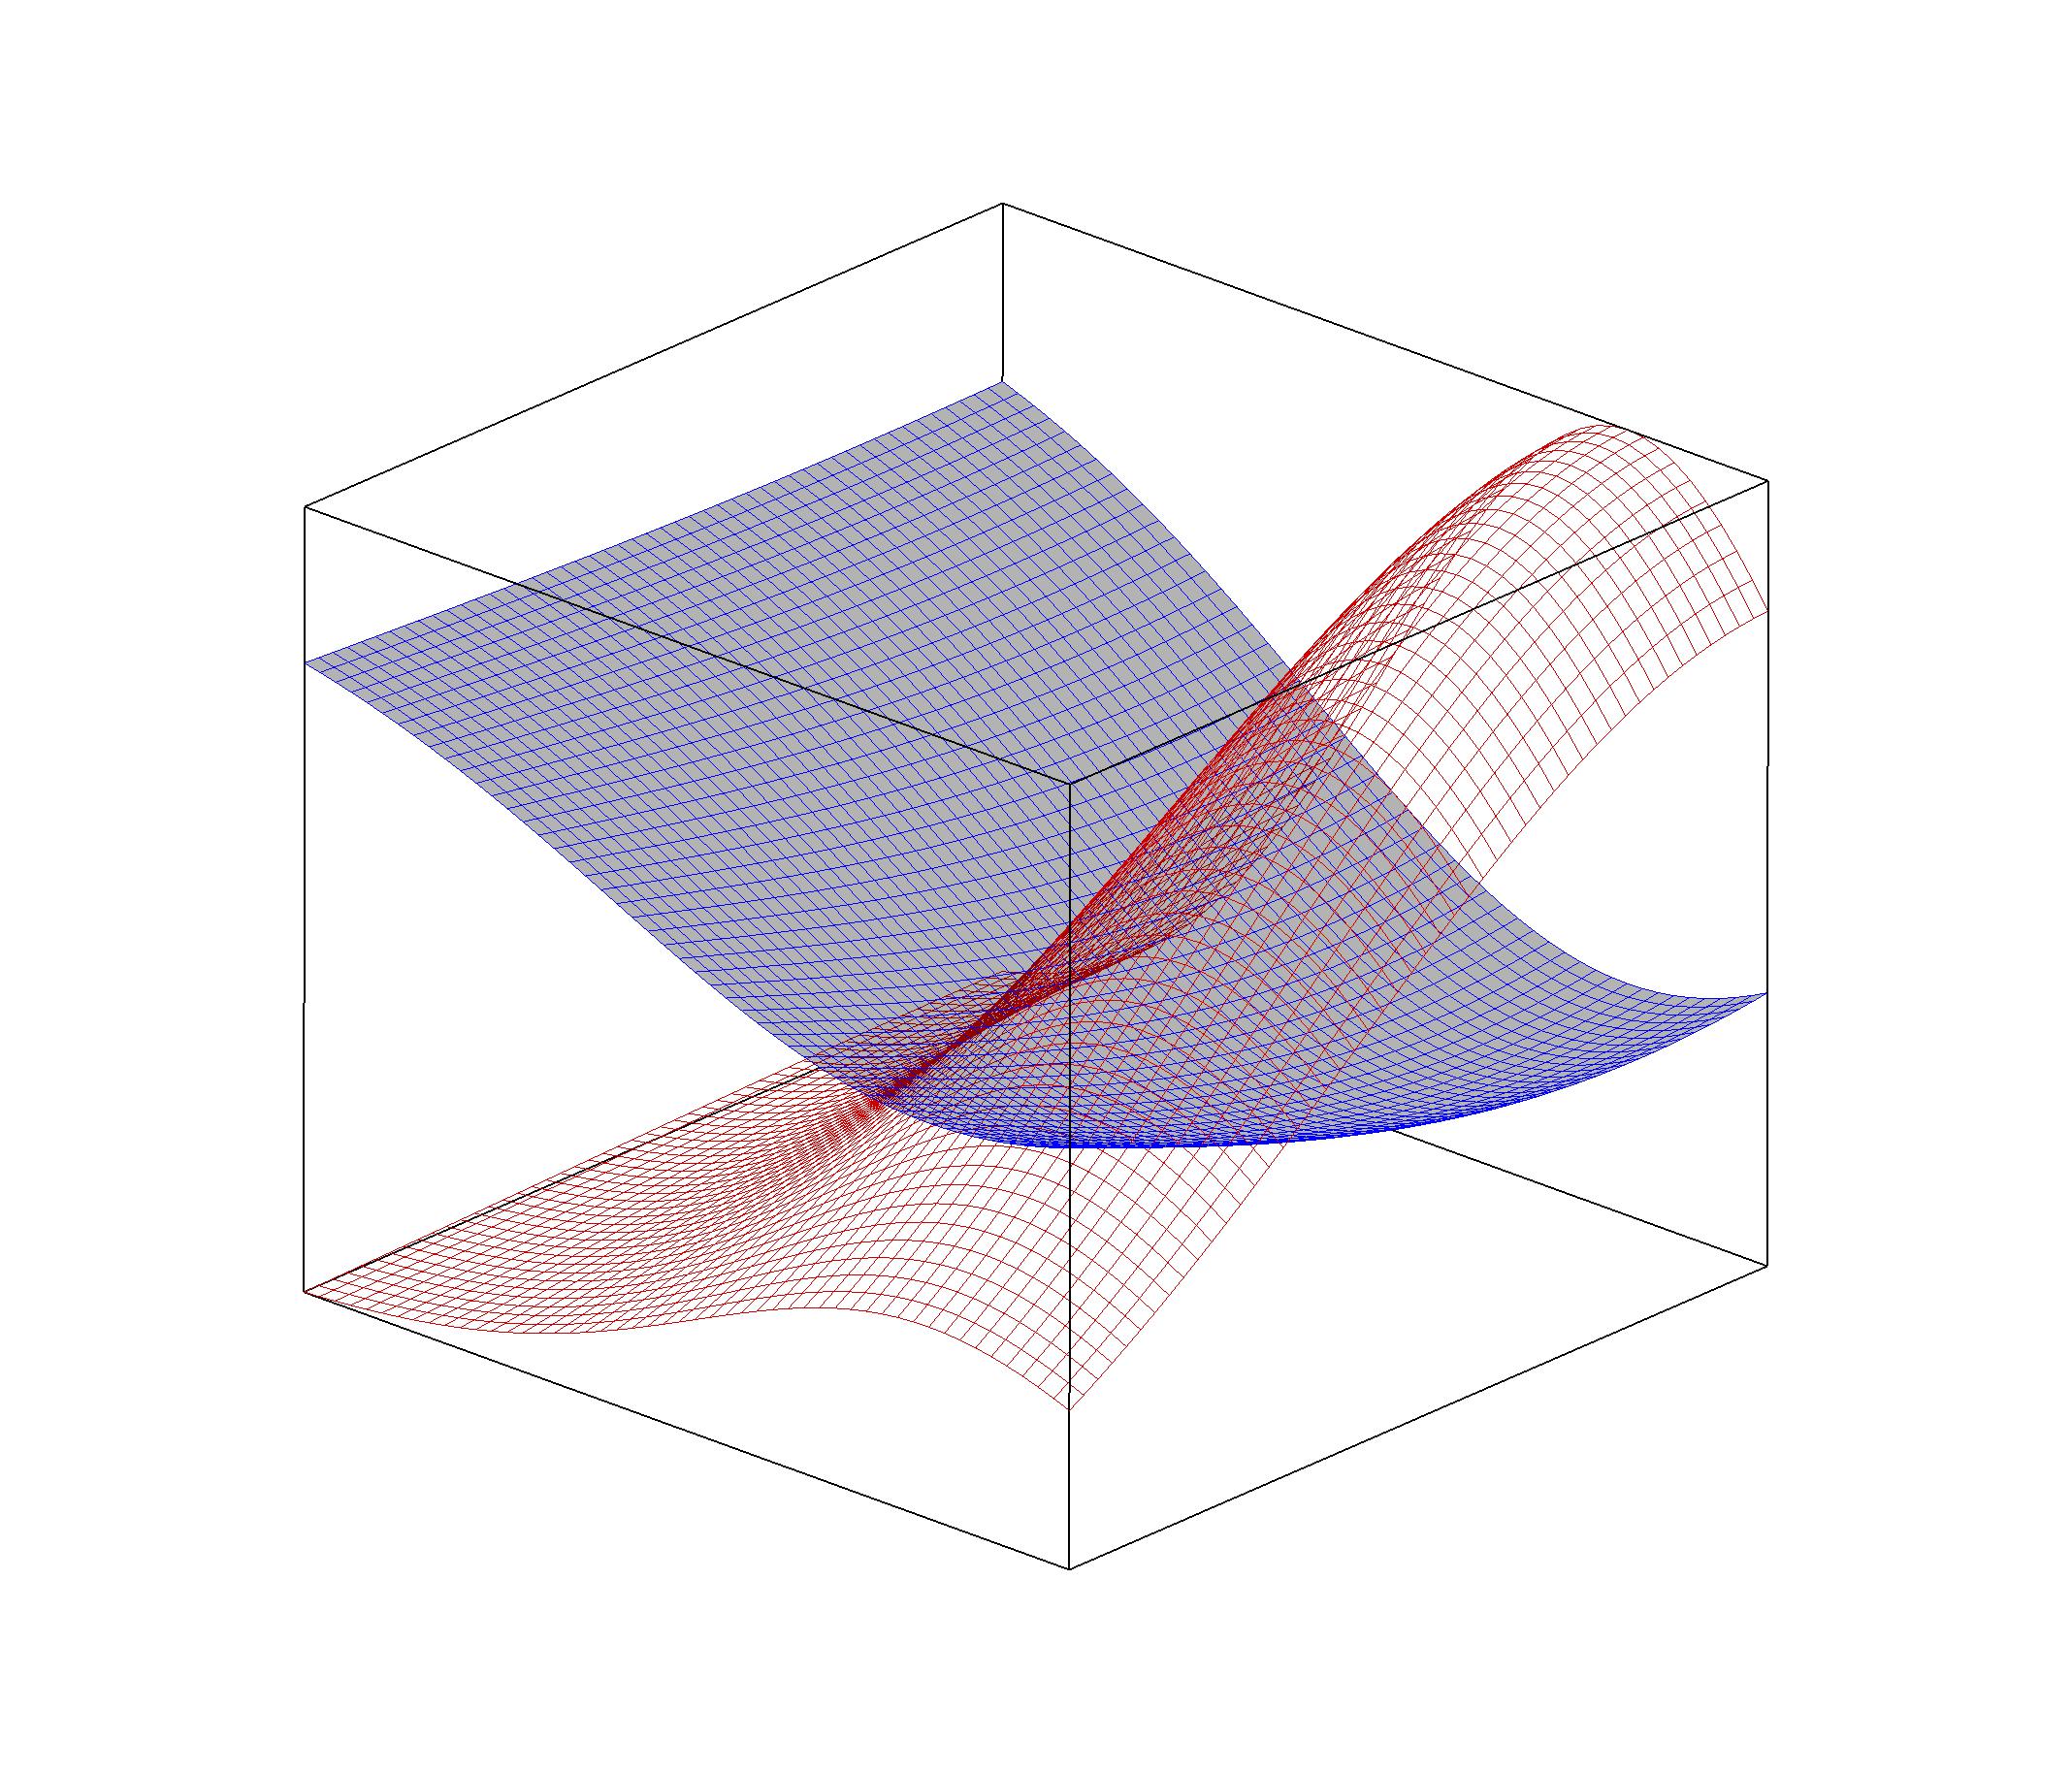
In some situations the intersection of two surfaces corresponds to a particular solution. For example, expressions of the form
f(x,y)=const
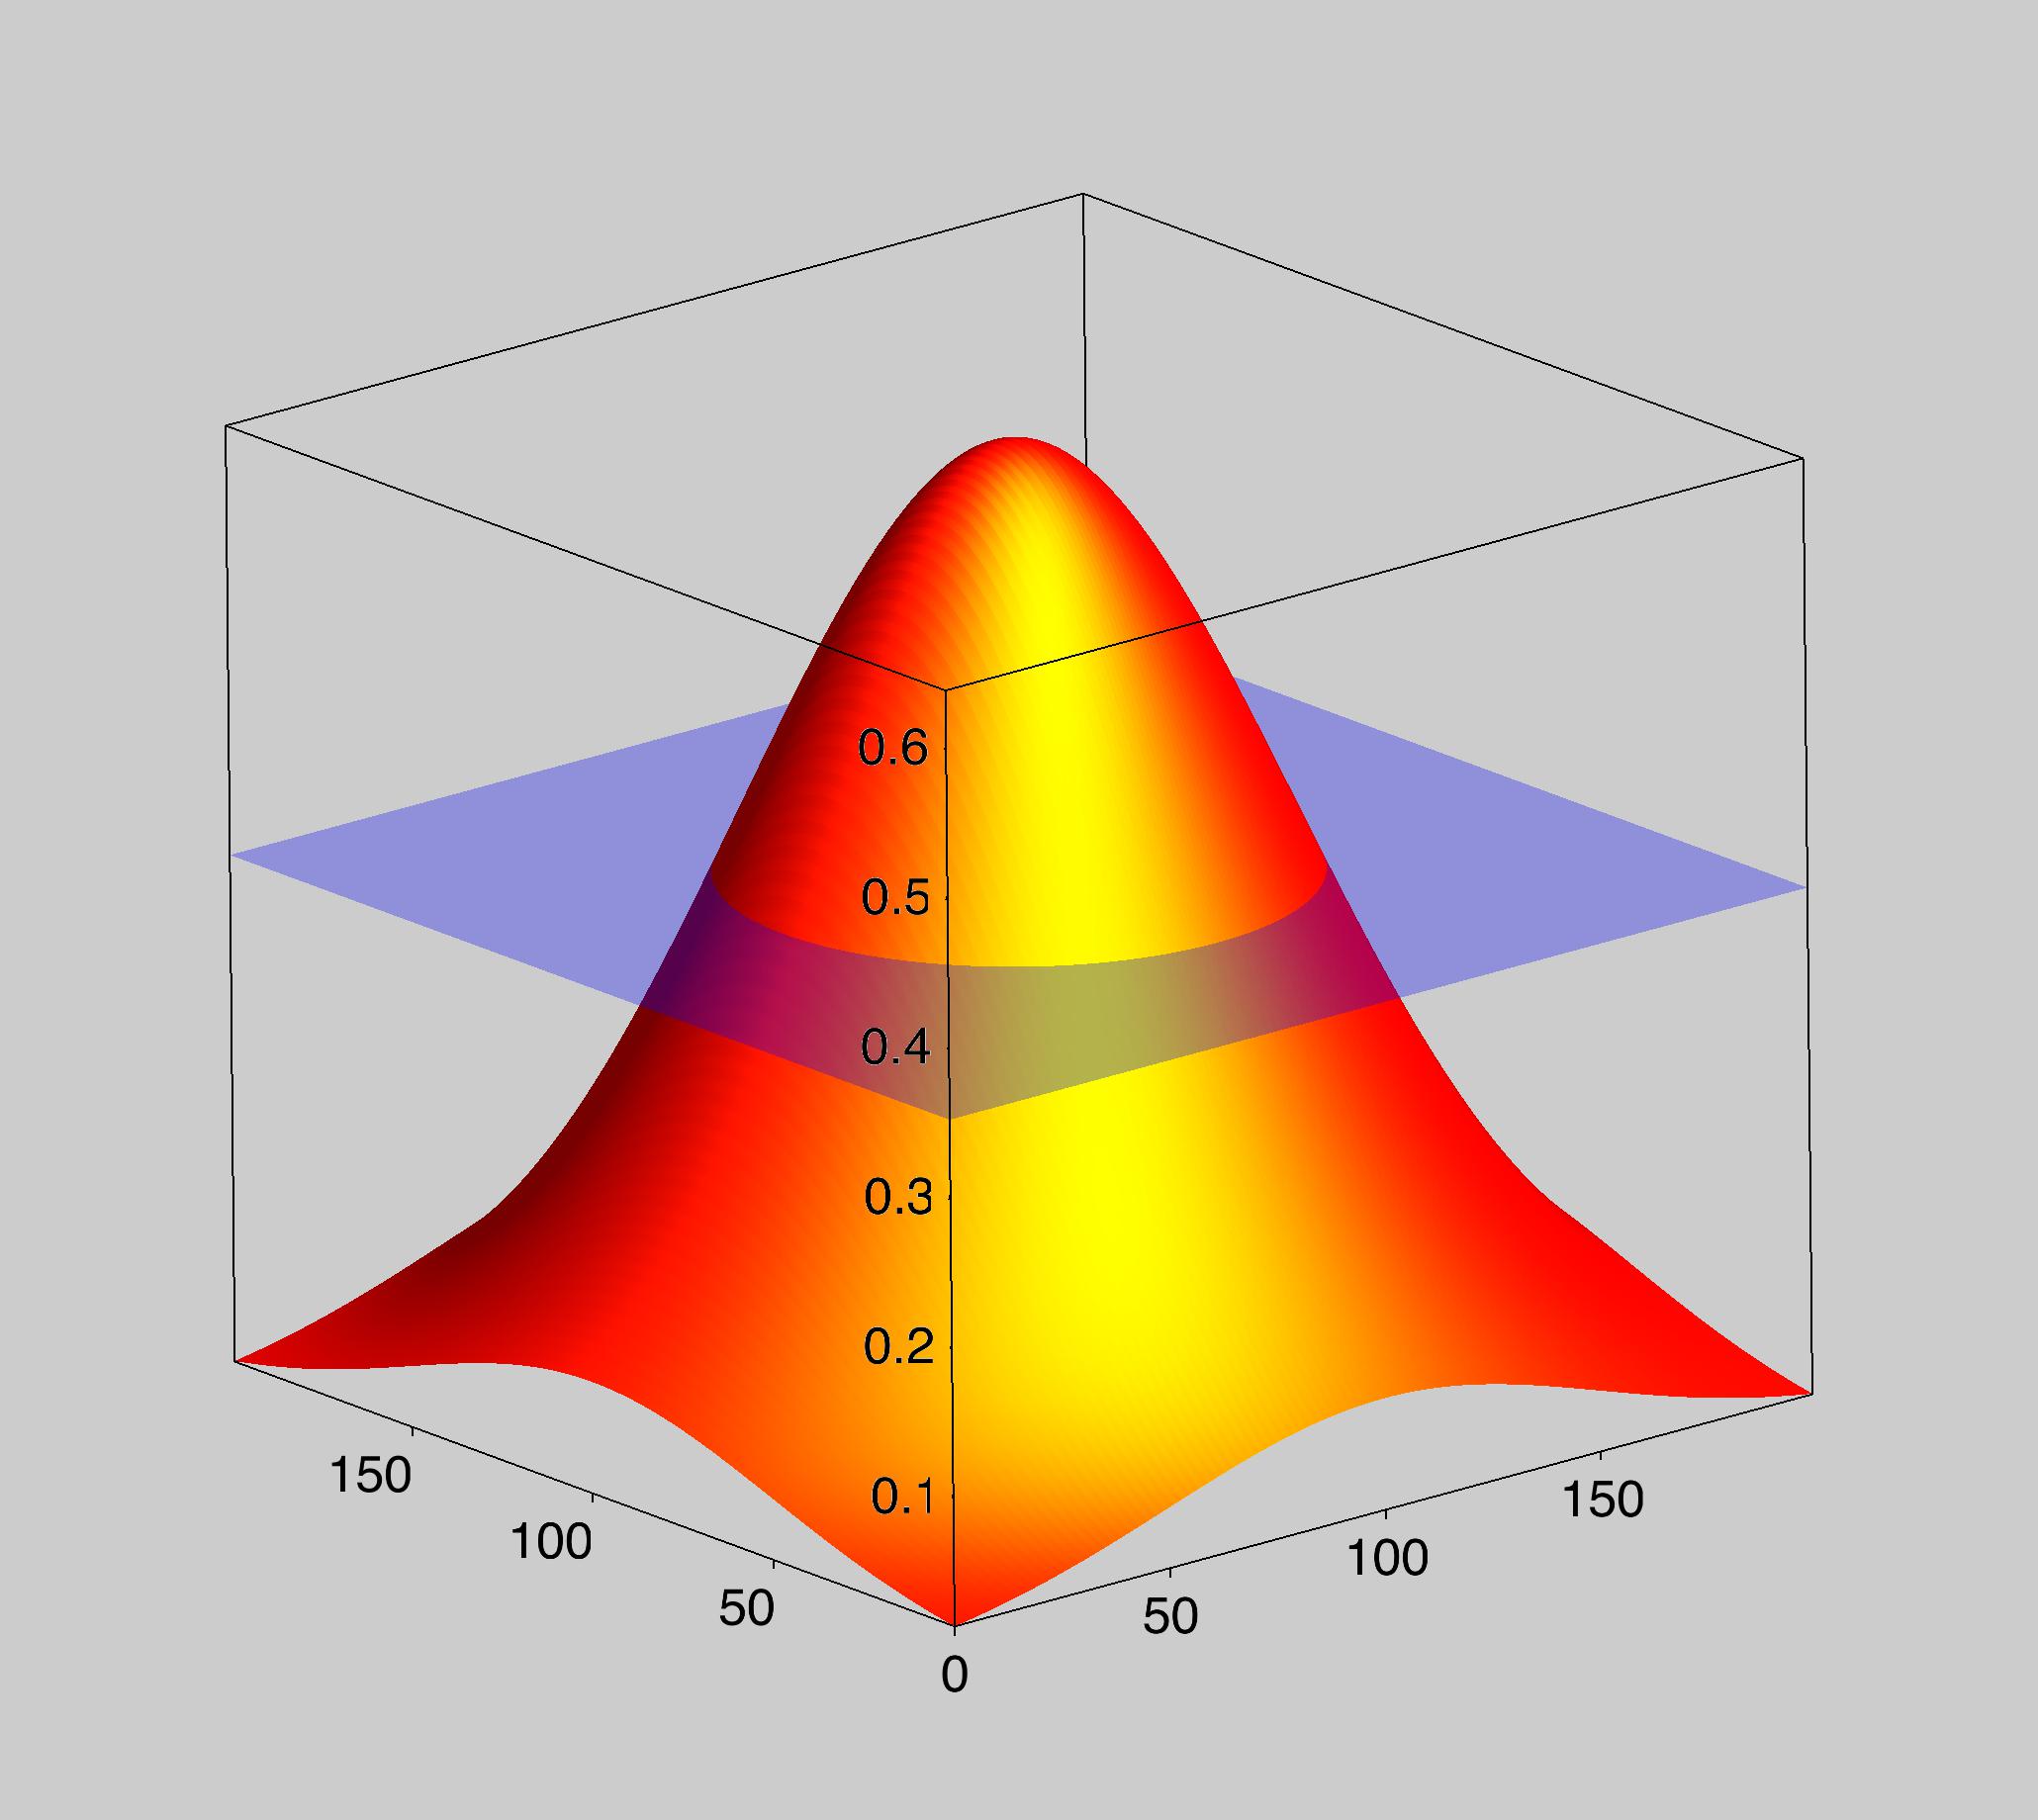
In this case the function f(x,y) is a Gaussian shaped surface. A secondary (transluscent) surface represents the plane
z=constant.
Parametric Surfaces
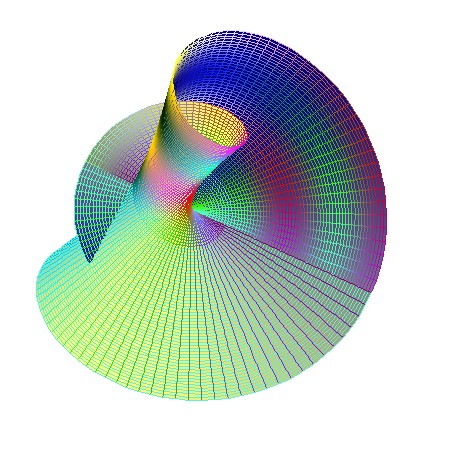
You can use Gizmo to plot arbitrary parametric surfaces. Here is an example where a Mobius type parametric surface is colored by a secondary set of data.
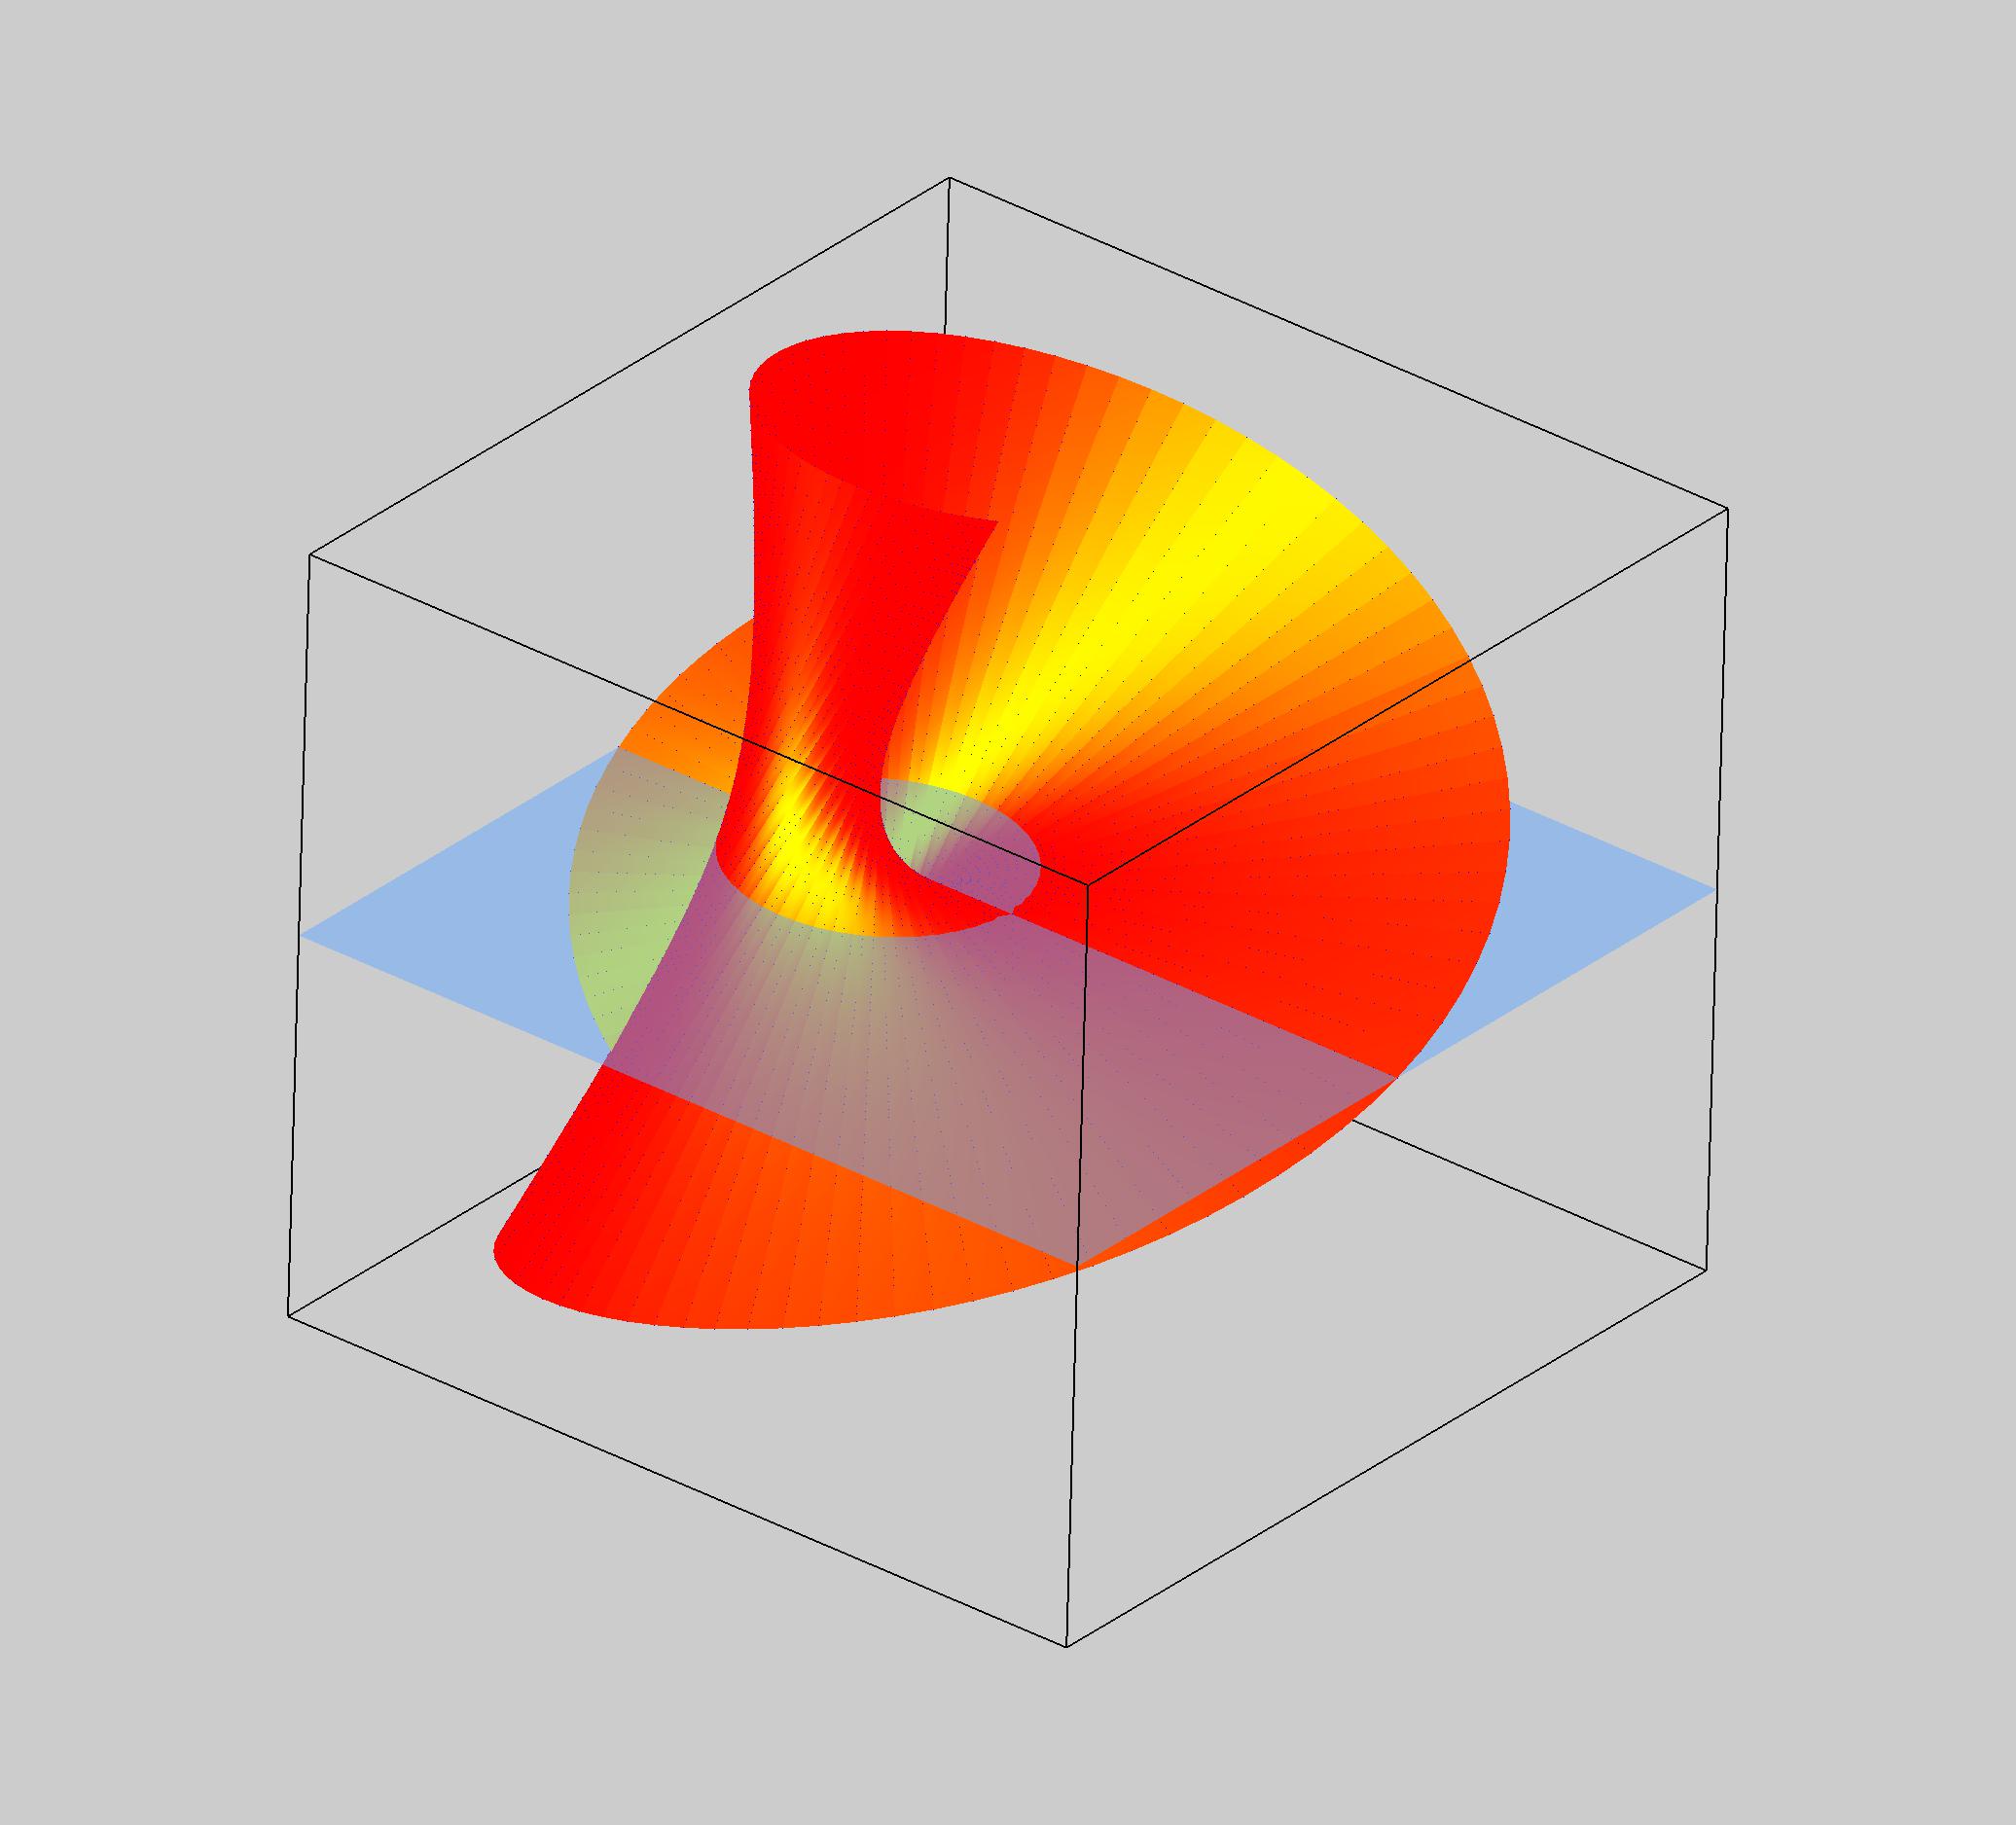
You can also combine a parametric surface with any other surface spanning the same space. Here is a simple example of a parametric surface intersecting a plane at z=0.

Forum

Support

Gallery
Igor Pro 9
Learn More
Igor XOP Toolkit
Learn More
Igor NIDAQ Tools MX
Learn More