Because Igor Pro® 's 2D graphs are so fast, you can quickly explore large data sets by zooming in and out on portions of a graph. You can drag a marquee selection around an area of interest and then click in the center to access a popup menu to expand or contract about that area. Here is an example: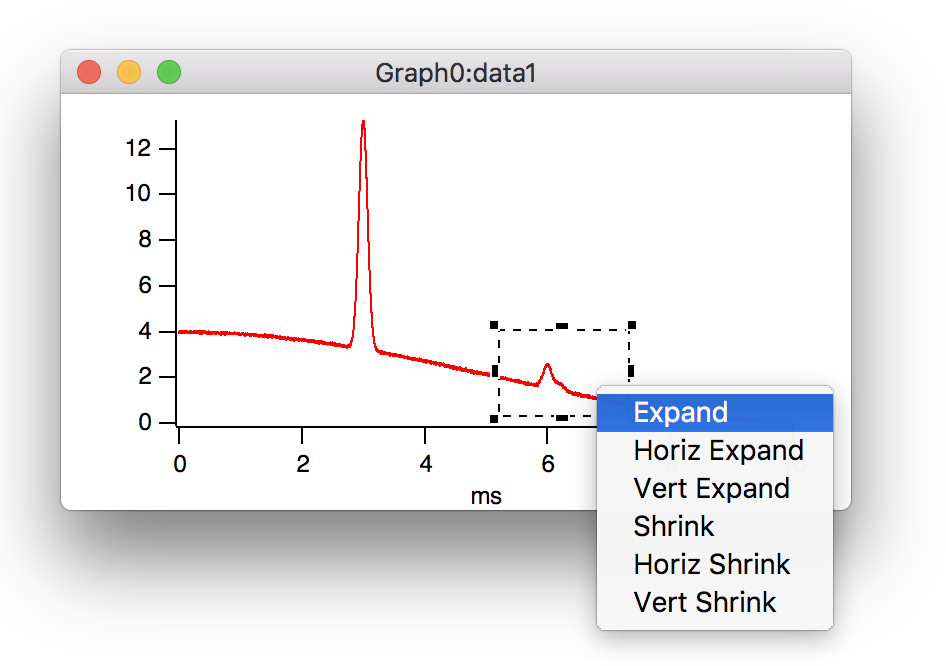
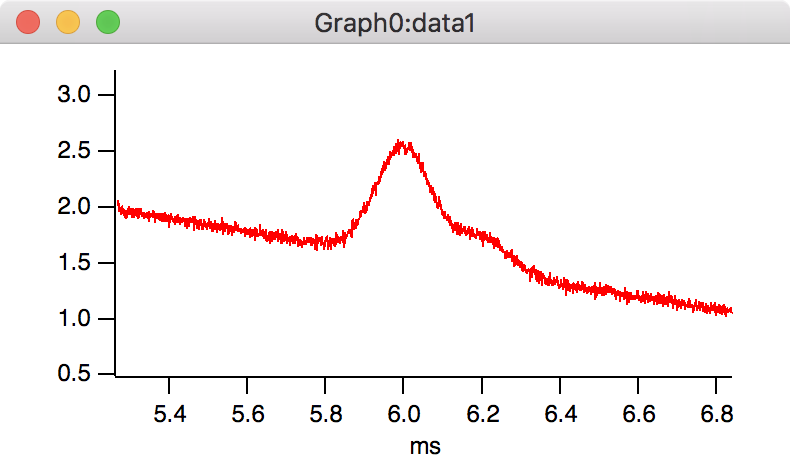
And here is the result after choosing expand:
Before choosing the popup menu, you can adjust the selection by dragging the marquee's handles. After zooming in on a region of interest, you can pan around in all directions.
Starting with version 6.1, you can hover your mouse over a point on an axis and use the mouse wheel to zoom in or zoom out about that point.
An even zippier tool is provided as a built-in procedure package that makes an copy of your graph with an expanded view of your data that follows the cursor as you move the mouse pointer over the original graph. You can experience the quickness of this tool for yourself by downloading the demo version of Igor (anonymous download -- no registration or forms to fill out) and then following these instructions:
- Start Igor and either:
- Load and graph your own data or
- Load any of the example experiments with graphs of large data sets or
- Create synthetic data by copying these lines...
Make/N=10000 data1;SetScale x,0,10e-3,"s",data1
data1= 2+2*cos(x*300)+10*exp(-(1e4*(x-3e-3))^2) + 1*exp(-(1e4*(x-6e-3))^2) + 0.3*exp(-(1e4*(x-6.2e-3))^2) + gnoise(0.03)
Display data1
...and then executing them in Igor. In Igor, type CTRL-J (Windows, cmd-J Mac) to bring the command window forward, paste and then press return.
- With the graph frontmost, from the menu bar, choose Graph->Packages->Graph Magnifier.
- In the resulting control panel, click Do It.
- Move your mouse over the data in the original graph.
- When finished exploring, click the Done button that was added to your original graph.
Info Box and Cursors
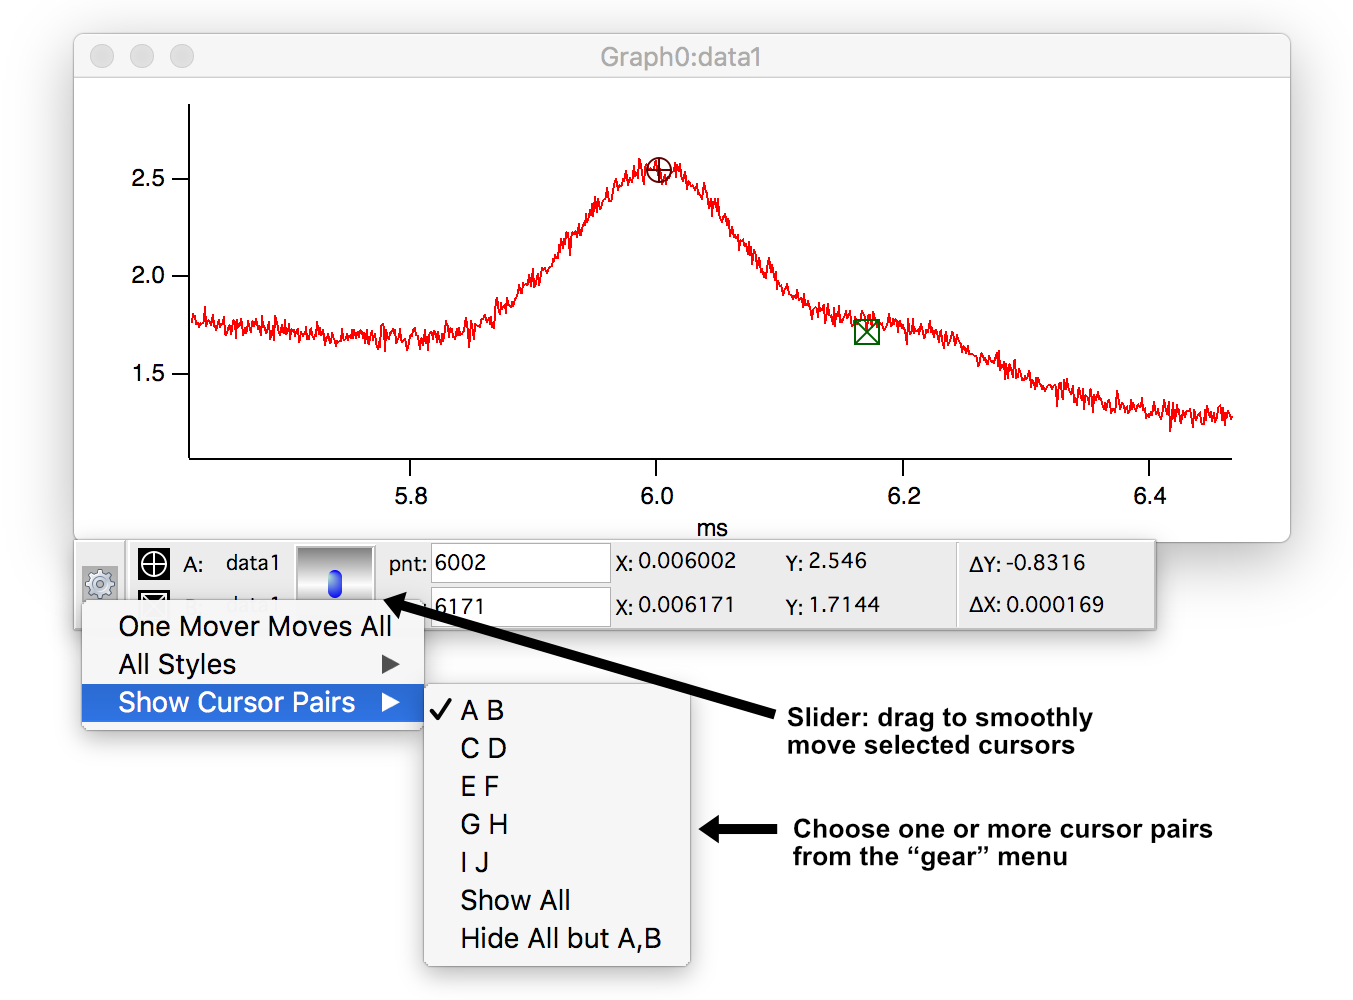
You can put an information box on a graph by choosing Show Info from the Graph menu while the graph is the target window. An info box displays a precise readout of values and also provides a convenient way to specify a region of interest for operations such as curve fitting.
Here is an example of the Info box and cursors on an XY plot:
And the following example shows that cursors can also be placed on image plots:
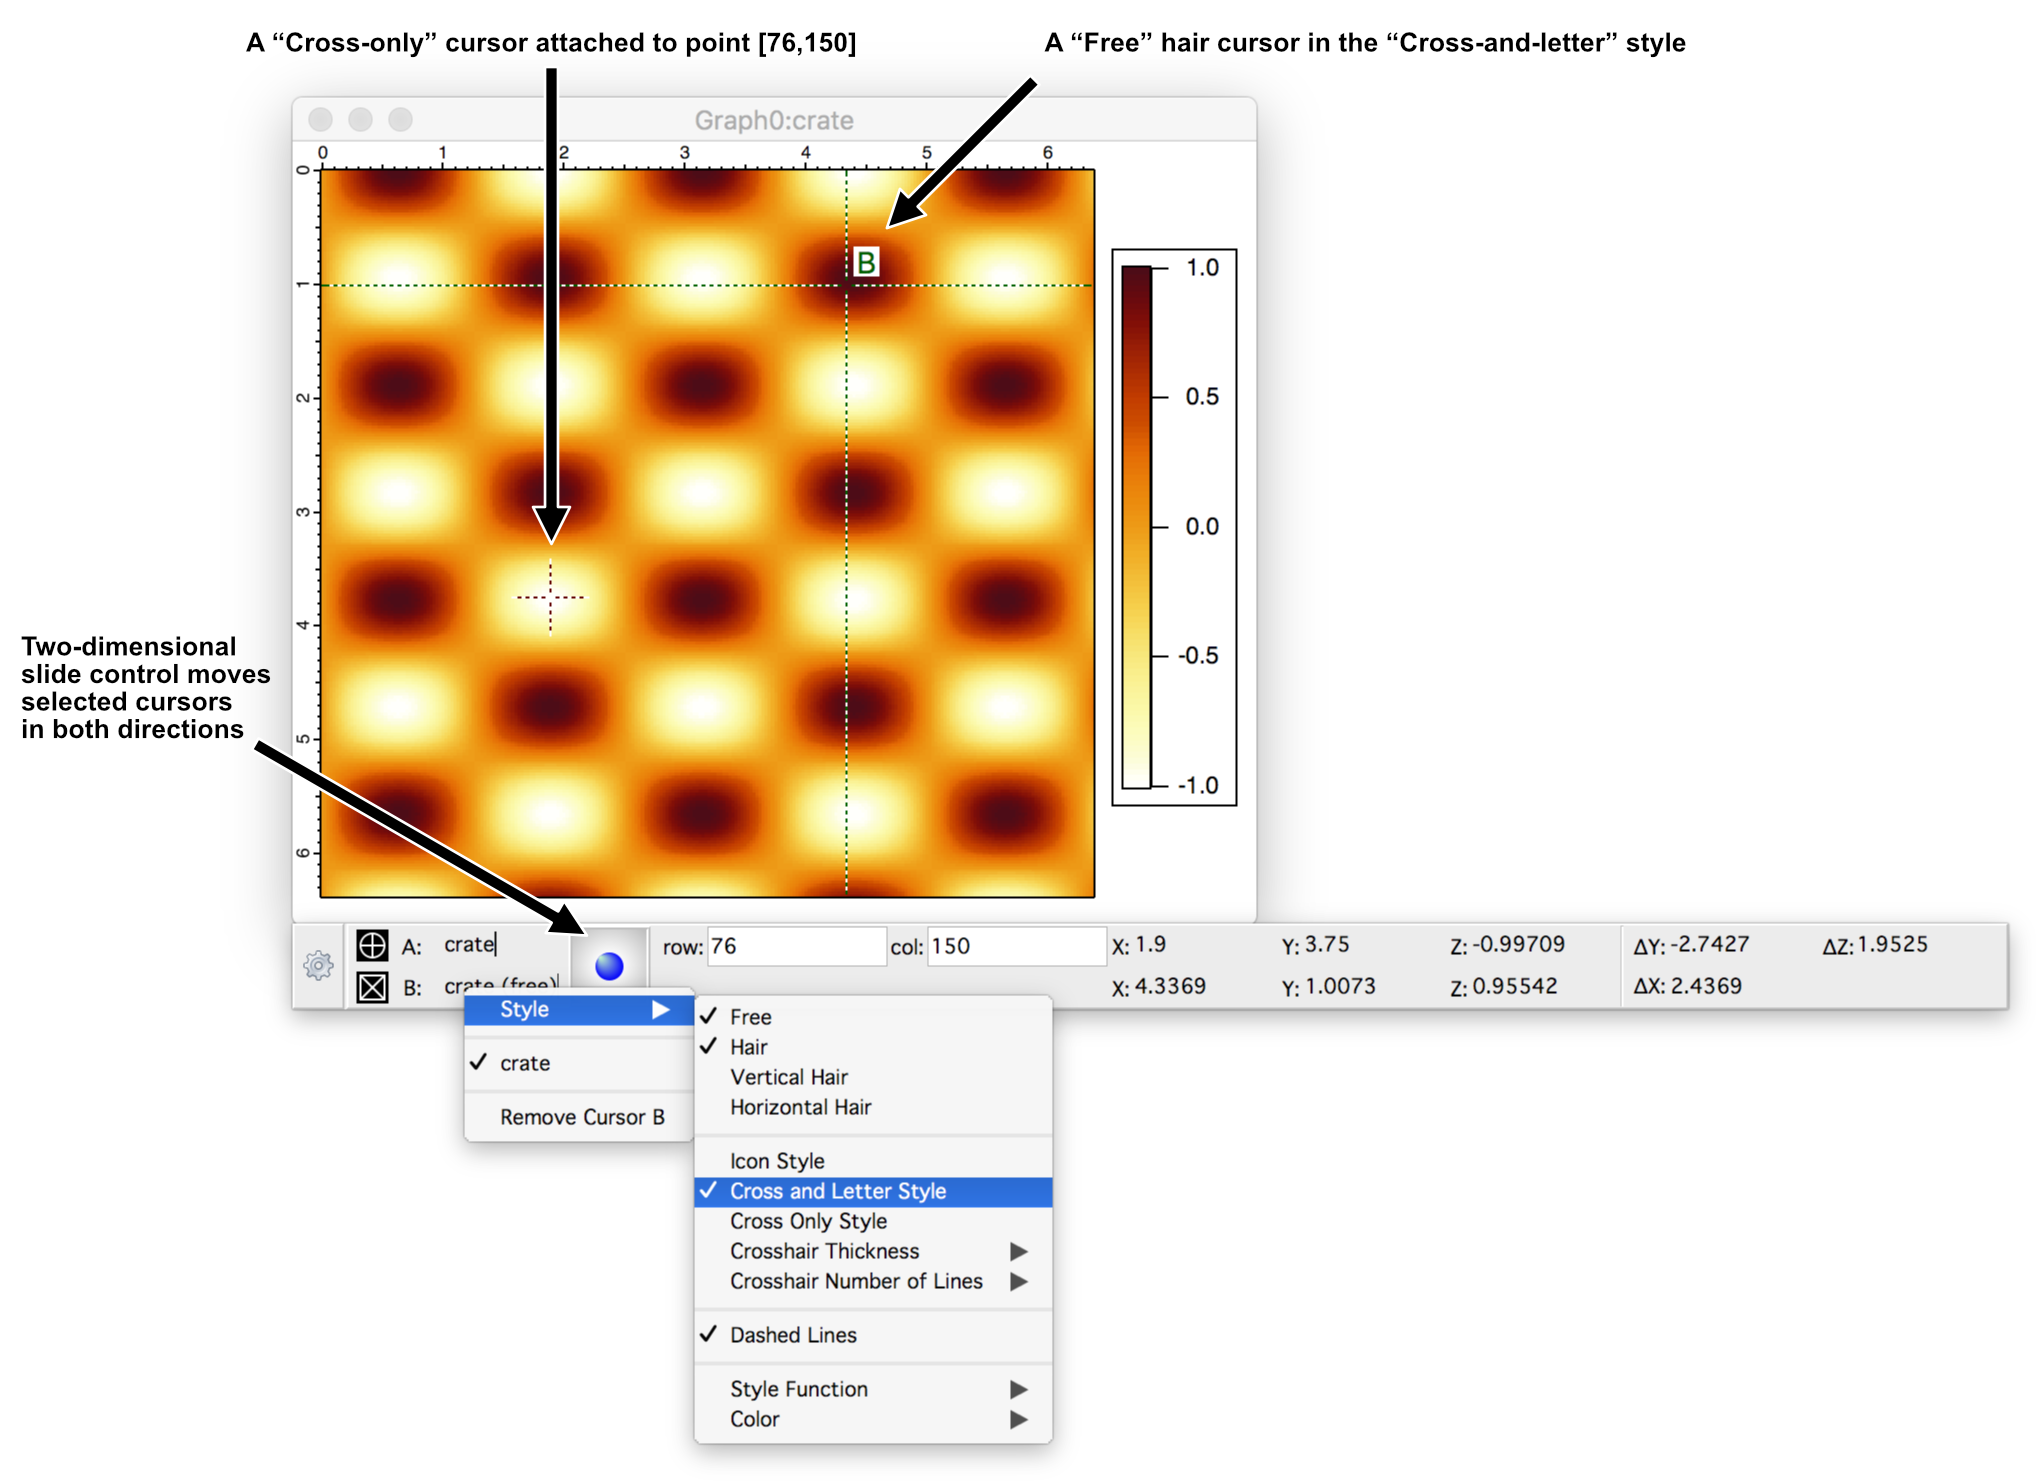
When cursors are placed on image or waterfall plots, z and delta-z values are added to the info box.
A variety of cursor styles are provided. Cursors may be attached to data points or may be free to roam throughout the plot area.
You can move cursors in several ways. In addition to the slider control shown in the examples, you can use the mouse to drag cursors to different points or different traces or images. Each graph window has its own info box and cursors.

Forum

Support

Gallery
Igor Pro 10
Learn More
Igor XOP Toolkit
Learn More
Igor NIDAQ Tools MX
Learn More