"Power Spectra" answers the question "which frequencies contain the signal´s power?" The answer is in the form of a distribution of power values as a function of frequency, where "power" is considered to be the average of the signal². In the frequency domain, this is the square of FFT´s magnitude.
Power spectra can be computed for the entire signal at once (a "periodogram") or periodograms of segments of the time signal can be averaged together to form the "power spectral density".
Periodogram
The periodogram computes the power spectra for the entire input signal:
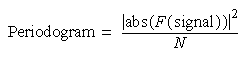
where F(signal) is the Fourier transform of the signal, and N is the normalization factor, which Igor´s DSPPeriodogram operation defaults to the number of samples in the signal.
The calculation of the periodogram is improved by spectral windowing, and Igor´s DSPPeriodogram operation supports the same windows as the FFT operation does.
The result of the periodogram is often normalized by a multiplication factor to make the result satisfy Parseval´s Theorem:
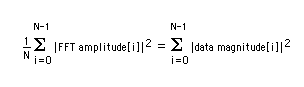
which presumes the two-sided frequency-domain FFT result is computed from the time-domain signal data, and where N is again the number of time-domain values in the signal.
Normalization of the periodogram result to meet this criterion follows several different conventions in the literature, (and depends on the average power of any spectral windowing function and also on whether the periodogram is one- or two-sided), so the DSPPeriodogram operation allows the user to specify the desired normalization using the /NOR parameter.
When using a window function, the amount of power in the signal is reduced. A compensating multiplier of 1/average(window[i]^2) should be applied to the result to compensate for this. For a Hanning window this value is theoretically 0.375. Because the normalization factor is a denominator, you would divide N by 0.375 to compensate for the Hanning window:
-
DSPPeriodogram/NOR=(numpnts(signal)/(2*0.375)) signal
Power Spectral Density
Power Spectral Density (PSD) is a frequency-domain plot of power per Hz vs frequency.
Averaging the periodograms of segments of long-duration signals more accurately assigns the power to the correct frequencies and averages to reduce noise-induced fluctuations in the power amplitudes. The tradeoff is that the frequency resolution is reduced because fewer data points are available for each FFT calculation.
The accuracy of the PSD is also improved by spectral windowing (each segment is windowed), but the windowing eliminates the contribution of the signal near the end of segment. The solution is to overlap the segments:
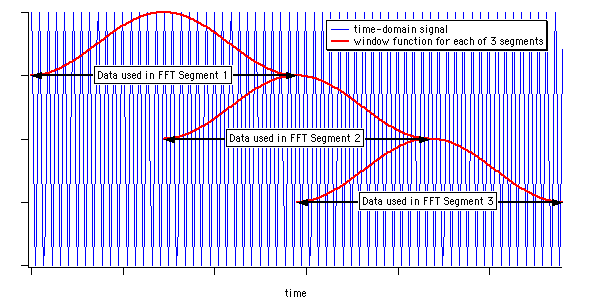
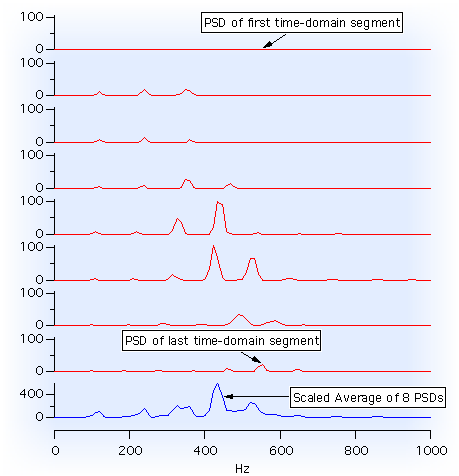
Here's an example of the averaging 8 periodograms from overlapping segments of a sampled sound:
Igor Pro®´s Power Spectral Density procedure file implements the PSD through the PowerSpectralDensity routine. To use this feature, enter the following in Igor´s procedure window:
-
#include <Power Spectral Density>
and select "PowerSpectralDensity" from Igor´s "Macros" menu.
The PSD Demo experiment contains a complete explanation of the normalization used to compute the Power Spectral Density.
References
- Press, William H. [et. al.], "Power Spectrum Estimation Using the FFT", sec. 13.4, Numerical Recipes in C, 2nd ed., Cambridge University Press, 1992.

Forum

Support

Gallery
Igor Pro 10
Learn More
Igor XOP Toolkit
Learn More
Igor NIDAQ Tools MX
Learn More