Fake Waterfall Plot

// Igor can display waterfall plots using the NewWaterfall operation (choose Windows->New->Packages->Waterfall Plot).
// This requires storing your data in a 2D wave. You can also create a 3D waterfall plot using Gizmo.
//
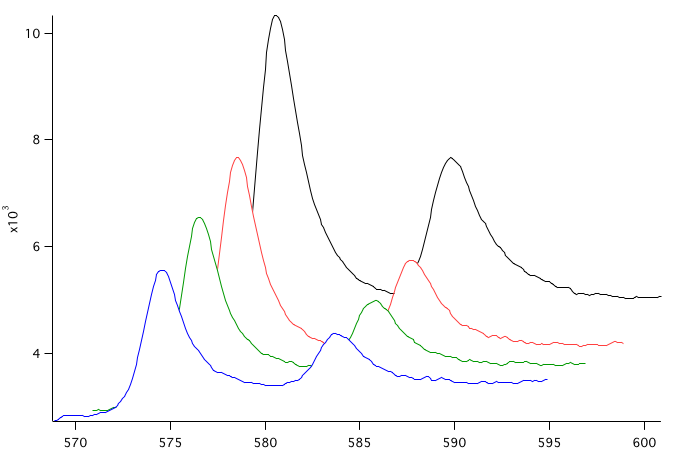
// However, for the common case of displaying a series of spectra, you may find that a "fake waterfall plot"
// is more convenient. And it works with your original waveform or XY data.
//
// A fake waterfall plot is a regular graph with multiple waveform or XY traces where you use Igor's X and Y
// trace display offset feature to create the waterfall effect. This is simple and also gives you a regular
// Igor graph with regular traces that you can format and annotate using familiar techniques.
//
// Here is a procedure for converting a regular graph with multiple waveform or XY traces into a fake waterfall plot.
// The ApplyFakeWaterfall function converts a regular graph to a fake waterfall plot.
// The RemoveFakeWaterfall function converts it back to a regular graph.
//
// The attached experiment file contains these procedures along with sample data and a sample graph.
Function ApplyFakeWaterfall(graphName, dx, dy, hidden) // e.g., ApplyFakeWaterfall("Graph0", 2, 100, 1)
String graphName // Name of graph or "" for top graph
Variable dx, dy // Used to offset traces to create waterfall effect
Variable hidden // If true, apply hidden line removal
String traceList = TraceNameList(graphName, ";", 1)
Variable numberOfTraces = ItemsInLIst(traceList)
Variable traceNumber
for(traceNumber=0; traceNumber<numberOfTraces; traceNumber+=1)
String trace = StringFromList(traceNumber, traceList)
Variable offsetX = (numberOfTraces-traceNumber-1) * dx
Variable offsetY = (numberOfTraces-traceNumber-1) * dy
ModifyGraph/W=$graphName offset($trace)={offsetX,offsetY}
ModifyGraph/W=$graphName plusRGB($trace)=(65535,65535,65535) // Fill color is white
if (hidden)
ModifyGraph/W=$graphName mode($trace)=7, hbFill($trace)=1 // Fill to zero, erase mode
else
ModifyGraph/W=$graphName mode($trace)=0 // Lines between points
endif
endfor
End
Function RemoveFakeWaterfall(graphName) // e.g., RemoveFakeWaterfall("Graph0")
String graphName // Name of graph or "" for top graph
String traceList = TraceNameList(graphName, ";", 1)
Variable numberOfTraces = ItemsInLIst(traceList)
Variable traceNumber
for(traceNumber=0; traceNumber<numberOfTraces; traceNumber+=1)
String trace = StringFromList(traceNumber, traceList)
ModifyGraph/W=$graphName offset($trace)={0,0}
ModifyGraph/W=$graphName plusRGB($trace)=(65535,65535,65535) // Fill color is white
ModifyGraph/W=$graphName mode($trace)=0 // Lines between points
endfor
End

Forum

Support

Gallery
Igor Pro 10
Learn More
Igor XOP Toolkit
Learn More
Igor NIDAQ Tools MX
Learn More