Igor Pro® is first and foremost a publication-quality scientific and engineering graphics program. Each element of a graph can be finely adjusted to meet your (or your journal’s) exacting requirements. For example, line thickness may be specified as 1.35 Points — not just 1 or 1.5. Not only are many dash patterns provided, but you can also customize them with a graphical dash pattern editor.
Virtually any graph you see in your favorite scientific or engineering journal could have been made using Igor — and many of them have been.
Simultaneously, Igor’s graphs are exploratory tools of the first order. Graph updating is extremely fast allowing you to smoothly zoom in and out and pan in all directions even with millions of data points. And unlike some competitors, Igor always plots all of your data so you don’t miss features that others may skip. Igor’s cursors provide live readouts of your xy or image data and can be used to specify data subsets for analysis. You can compose fancy text annotations called tags that dynamically update as the data changes or as you move a tag to a different data point. Graphs automatically update to take full advantage of the available space when you resize a graph window.
Igor’s 2D graphs are exceedingly flexible. You can create graphs with an unlimited number of traces, axes, contour plots, images and annotations. You can embed graphs within other graphs and can compose page layouts with multiple graphs, tables, annotations and pictures.
Speaking of flexible, Igor’s image plots can use any data type from unsigned byte to double precision complex (complex data is automatically presented as magnitude.) Pixels can even have uneven spacing as with a log axis or user specified x or y values. Images can be true color or many different forms of false color. You can even specify what happens for out-of-range data.
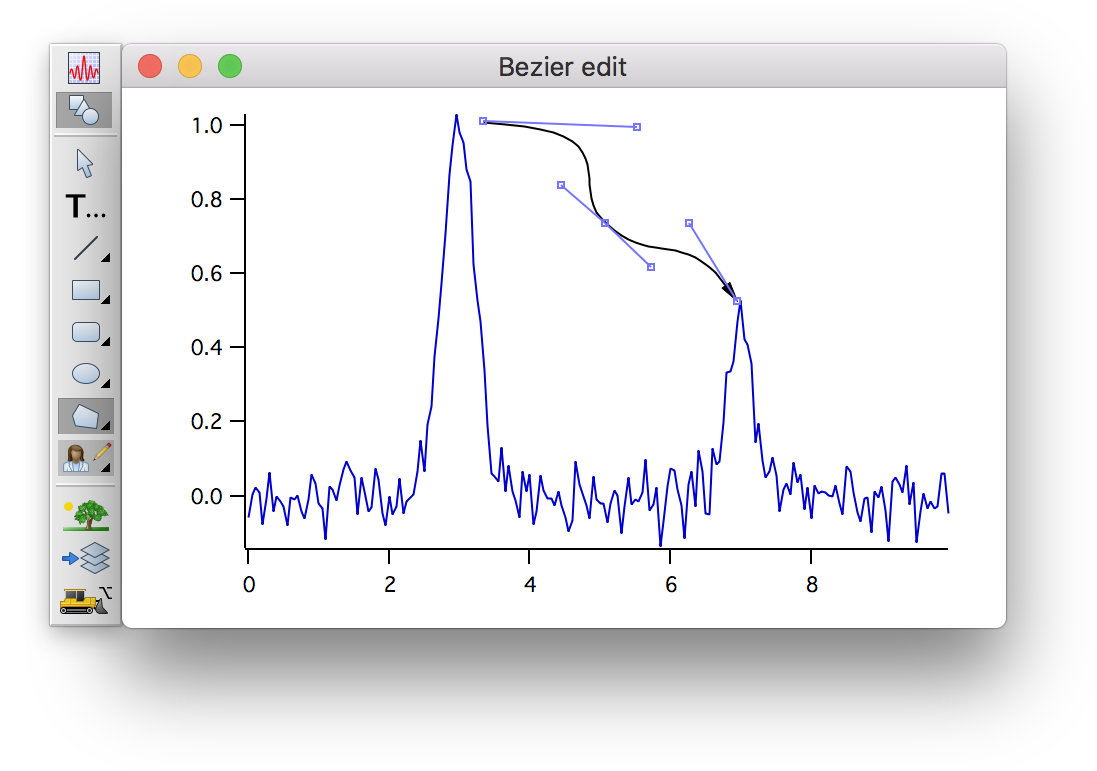
You can use Igor’s powerful drawing tools to annotate your graphs or page layouts with lines, arrows, rectangles, Bezier curves and many other types. Multiple layers are provided and all tools may be used programatically. Unique to Igor is the ability to specify the coordinate system for draw objects. For example, you might specify the coordinates of a background shaded area to be in terms of a pair of axes. This would allow you to zoom or otherwise adjust the axis ranges but still have the shaded area remain in the correct location relative to the data.
You can use Igor’s annotation editor to create precise and sophisticated text annotations. Igor goes way beyond simple sub- or superscripts with precise and flexible layout. Annotations can be designed to automatically respond to changes in font or size and can dynamically include data values.
You can create visually stunning 3D graphics using Igor’s Gizmo module. Be sure to visit the gallery as well as the 3D graphics web pages to see these “cool” graphics.

Forum

Support

Gallery
Igor Pro 10
Learn More
Igor XOP Toolkit
Learn More
Igor NIDAQ Tools MX
Learn More