Image data can be false color (data in matrix is mapped onto a continuous color table), indexed color (data acts as an index into a table of discrete colors) or full color (each data point contains red, green and blue values).
Here is a false-color image plot of elevation (Z) versus longitude (X) and latitude (Y):
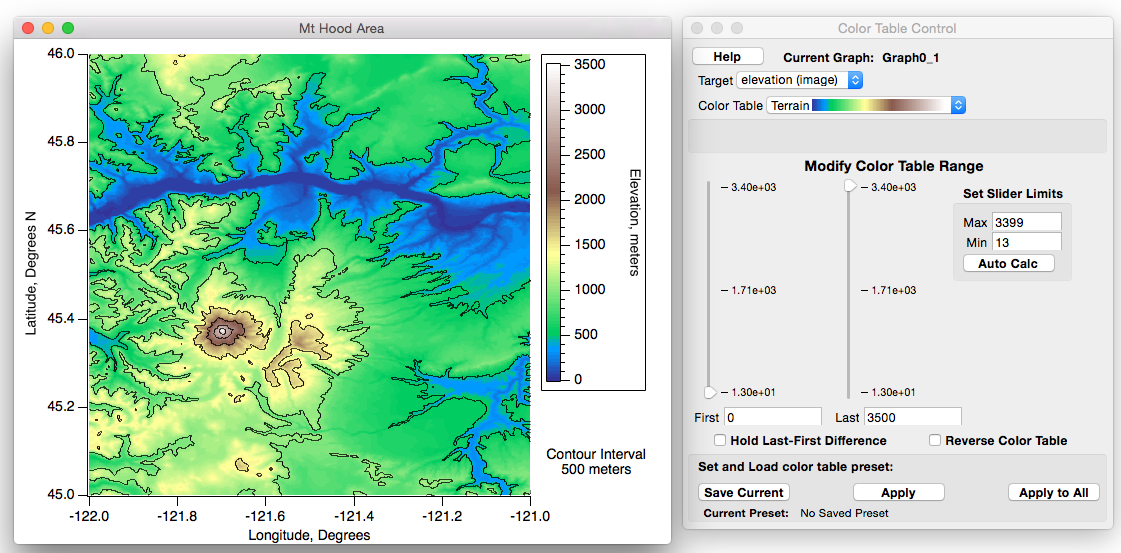
Images can be plotted using non-linear user-supplied spacing and can even be plotted on a log axis. Multiple images can appear in a graph along with regular graph traces and with contour plots.
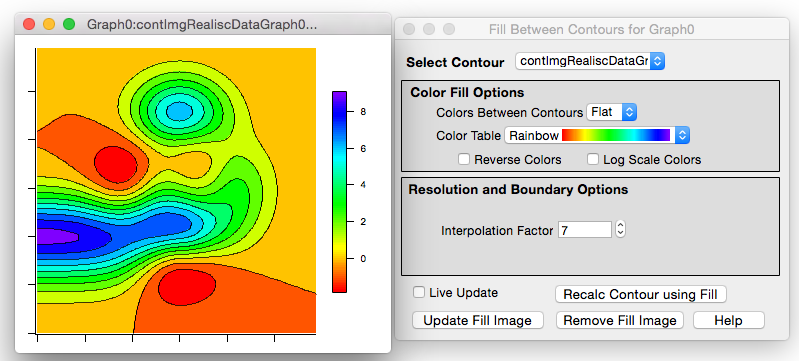
Image data can be 8, 16 and 32 bit signed or unsigned integers and 32 or 64 bit floating point.
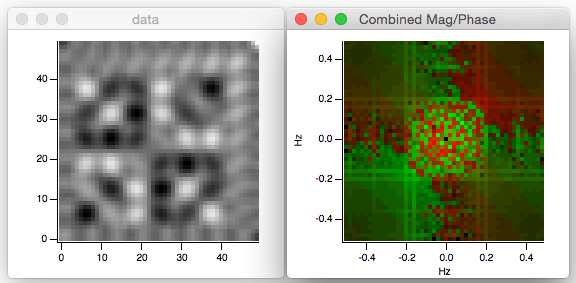
Complex multi-dimensional data is automatically shown as magnitude. You can also choose to view real, imaginary and phase components.
You can compute the FFT of a matrix, and display it as an image, with magnitude, phase, or both. This is an example from the Image MagPhase Demo:

Forum

Support

Gallery
Igor Pro 10
Learn More
Igor XOP Toolkit
Learn More
Igor NIDAQ Tools MX
Learn More