Atmospheric Chemistry Research
Data analysis of an atmospheric research project using Igor
At the moment I am working at the Airchemistry Department of the Max-Planck-Institute for Chemistry in Mainz (Germany). Our research focuses on different questions concerning the dynamics and chemical composition of the troposphere and the lower stratosphere. Besides the development of computer models we also perform field measurement campaigns to improve our knowledge about the processes in the 'real world'.
As part of my PhD thesis I was able to join the SPURT (SPUrenstofftransport in der TRopopausenregion / Trace gas transport in the tropopause region) project. During the years 2001 - 2003 we performed eight intensive field operations using a Learjet 35a research aircraft (see top picture on the right). This aircraft was equipped with lots of scientific instrument to be able to make insitu measurements of trace gases like CO, O3, H2O, CH4. Each intensive field operation consists of two days flying all over europe, reaching from Casablanca in Morocco in the south to Longjearbyen at Spitzbergen in the north. Overall we got 136 hours of flightdata!
After gathering of the data, lots of number-crunching tasks had to be done to evaluate the raw data. In addition to the measured ambient data a lot of model data were calculated, especially important: 10-day backward trajectories initiated along the flightpath. (I must admit, they were not calculated using Igor...) To give you an impression of these data: nearly 50000 trajectories, each in 6 hour intervals 10 days back for 8 different parameters result in about 16 million data points for the whole dataset!
The role of Igor
We are using Igor as a tool for the data evaluation and for visualizing data during analyses. As an example I would like to present a picture of a GIZMO view I used quite often in the last weeks:
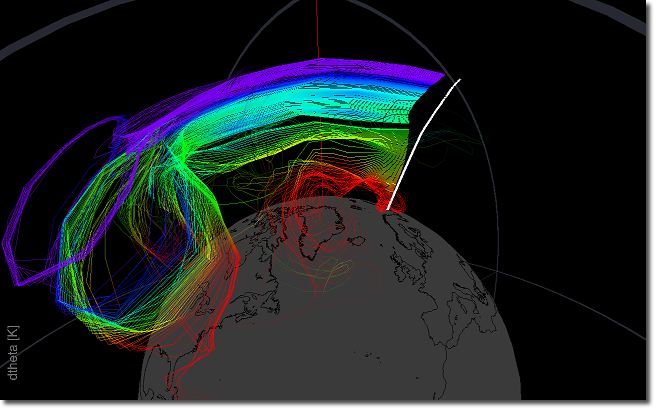
What you see is a visualization of calculated 10-day backwards trajectories initiated along the flightpath of one ascent over Norway. In grey you could see the surface of the earth with the coastline in black (right is Europe, in the middle Greenland and on the left the United States and Canada). In white you could see the flightpath (with the altitude dimension strongly enhanced). You can click on the image to view a animation (3.2MB, Quicktime)
The trajectories are coloured in a variable called 'dTheta' which means the difference between the altitude of the trajectory and the local tropopause expressed in degrees of potential temperature. This measure gives us an indication, wheter the air is still in the troposphere or already in the stratosphere.
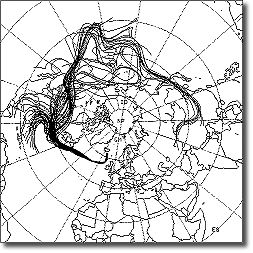
The big advantage using Igor in contrast of using conventional 2D plots (see example on the right side) is the 3D-view capaility of the GIZMO plots. I have the possibility to rotate the trajectories in real-time, color them depending on different variables, using alpha blending to enhance special parts of trajectories and so on. This helps us very much to speed up analyses and interpretation of the data.
Christian Gurk
Airchemistry Department
Max-Planck-Institute for Chemistry
Mainz, Germany

Forum

Support

Gallery
Igor Pro 10
Learn More
Igor XOP Toolkit
Learn More
Igor NIDAQ Tools MX
Learn More