ZeFir - Tracking Pollution Back to the Origin
ZeFir was a circa-2017 Igor-based package that allowed user-friendly coupling between pollutant concentrations and wind data or air mass origin. Statistical analysis from AMS/ACSM data was performed in Igor through dedicated user-friendly panels: the PMF Evaluation Tool and SourceFinder. The authors have since replaced this package with SoFI Pro at Datalystica, which as of June 2023 still uses Igor Pro.
Motivation
The knowledge of the sources and (trans-)formation processes governing air pollution is a major scientific concern. Recent mathematical developments, especially Positive Matrix Factorization (PMF) approaches, have allowed the identification of sources from atmospheric data, and thus have dramatically increased our understanding of the synergy between sources, chemical composition and meteorology.
However, if source apportionment is a major step towards adapted mitigation pollicies for improved air quality, the geographical origins of these sources are crucial information as well. ZeFir is an Igor-based package that allows user-friendly coupling between pollutant concentrations and wind data or air mass origin.
Why Igor?
Within the atmospheric science community, Igor is now widely used because Aerosol Mass Spectrometers require this software for data acquisition, processing and analysis. Moreover, statistical analysis from AMS/ACSM data can now be performed in Igor through dedicated user-friendly panels.
Wind Analysis
Wind Analysis consists in coupling concentration data at a sampling site and collocated wind measurements, i.e. direction and/or speed. Various methodologies exist, and the philosophy of ZeFir is to make most of them available to the scientific community.
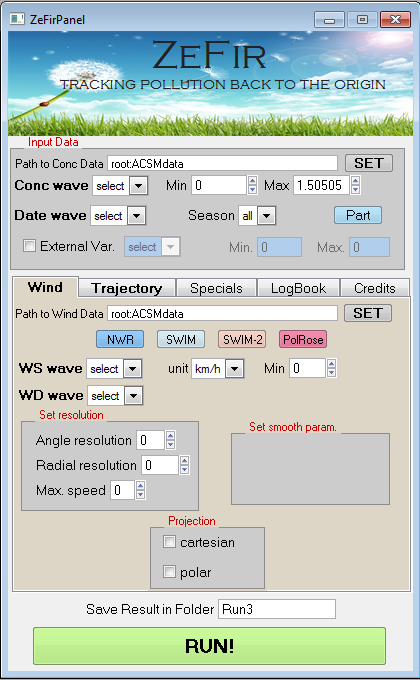
As of now, ZeFir allow the use of Non-parametric Wind Regressions, and pollution roses.
Here is an example showing four ways to plot 1-h NOx data from Metz (France) during 2015.
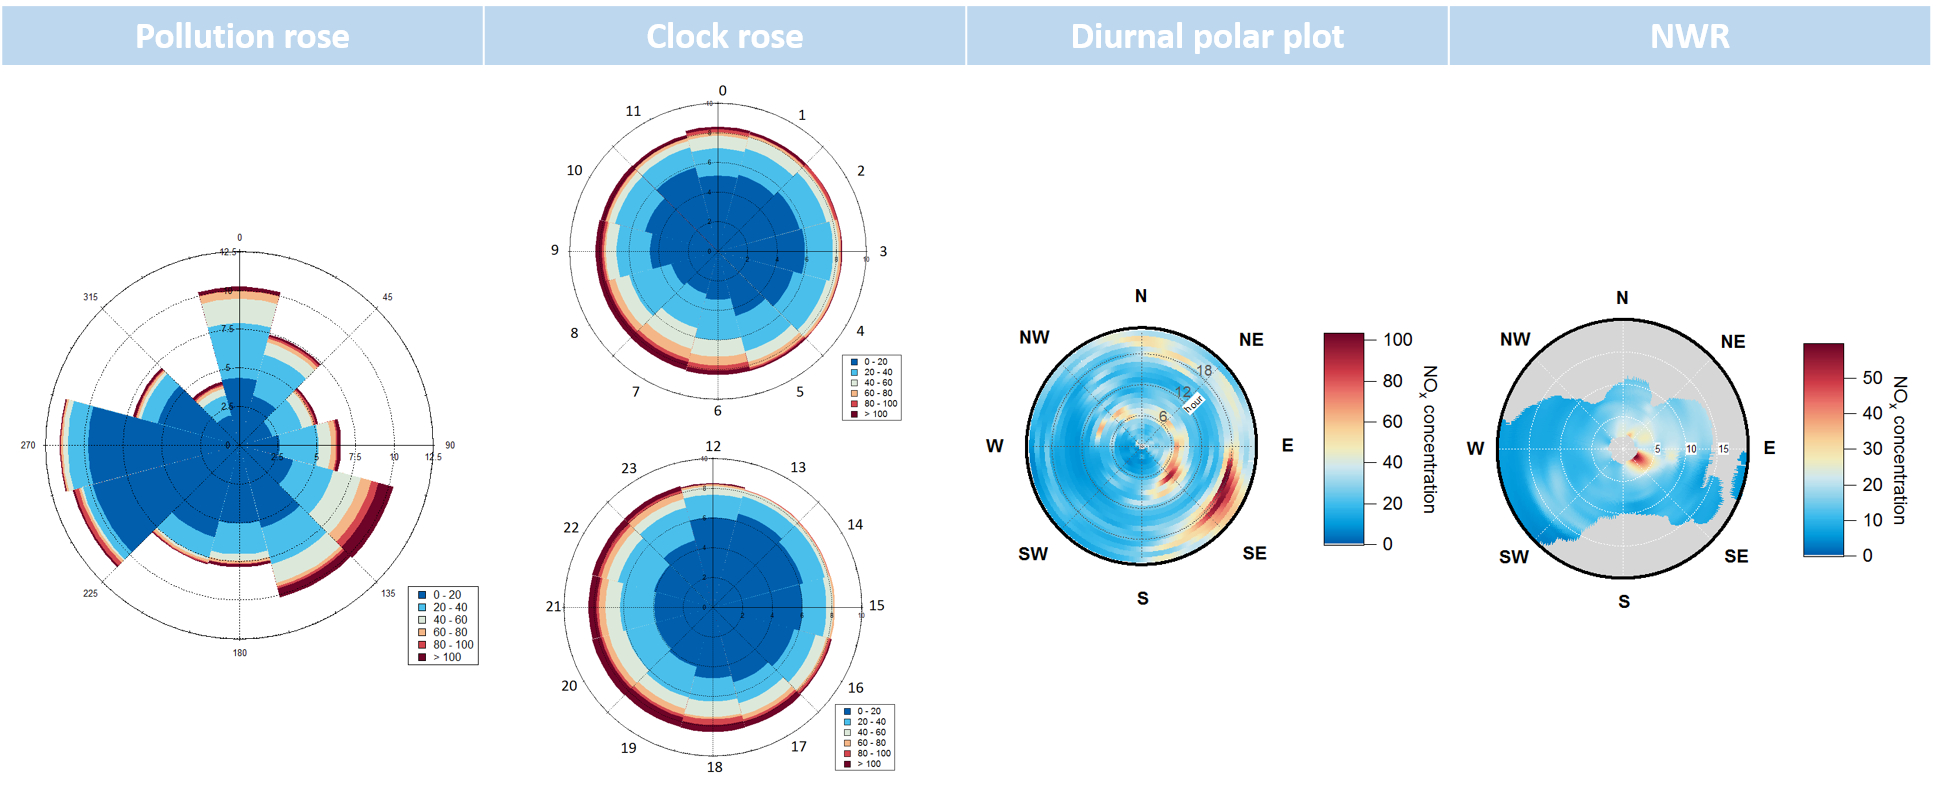
The Clock rose is obtained by using the “Pollution Rose” statistic, with WD Wave being angles representing hours (i.e. here, WD=mod(hour*30,360)). The dataset have been divided into subsets following an external variable, being the hour values between 0 to 11h, and 12h to 23h.
The Annular plot is similar to what can be done with Openair. It is a NWR calculation, where wind speed is replaced by the hours. There is thus information about diurnal variation, and wind direction dependence.
This example puts the emphasis on the fact that they are many ways possible to explore any kind of dataset, some of them being available in ZeFir. The user should not hesitate to go beyond the proposed features. For example, ambient temperature or RH can be used as a “pollutant” to illustrate its wind dependence, or as bivariate variables using Cartesian coordinates.
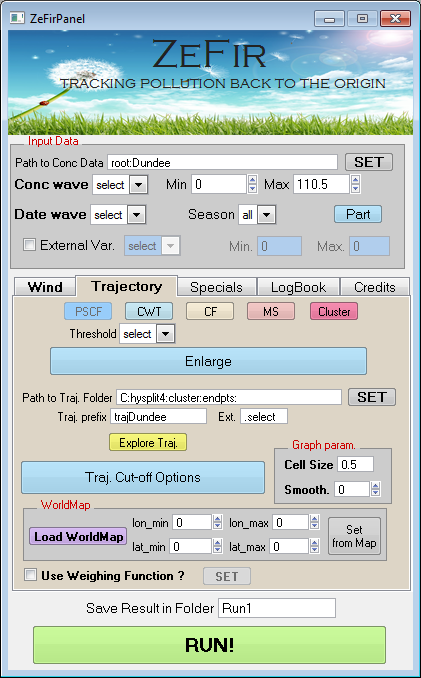
Trajectory Analysis
Several methodologies nowadays coexist in order to couple concentration data and air mass history. The majority of these are enabled in ZeFir; Potential Source Contribution Function (PSCF), Concentration-Weighted Trajectory (CWT), Concentration Field (CF), Multi-site Merging, and Cluster analysis.
Below is the panel dedicated to trajectory analysis in ZeFir.
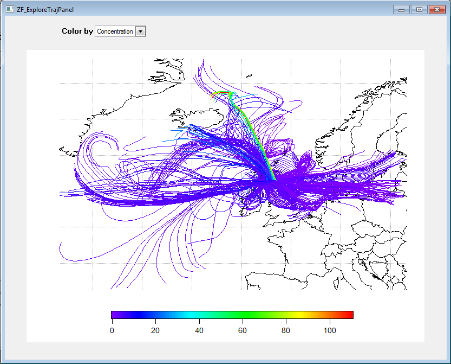
A simple plot of trajectories can be easily loaded and plotted. Here, they are colour-coded following SO2 concentrations:

Forum

Support

Gallery
Igor Pro 10
Learn More
Igor XOP Toolkit
Learn More
Igor NIDAQ Tools MX
Learn More