Igor Pro® 9 contains hundreds of improvements, including 58 new operations and functions, and built-in support for HDF5. Some of these changes are highlighted below. Click here for a more detailed description of the Igor Pro 9 changes.
All Igor Pro 8 licenses (new and upgrades) sold on or after September 1, 2020 are eligible for a free upgrade to Igor Pro 9.
General
Autosave
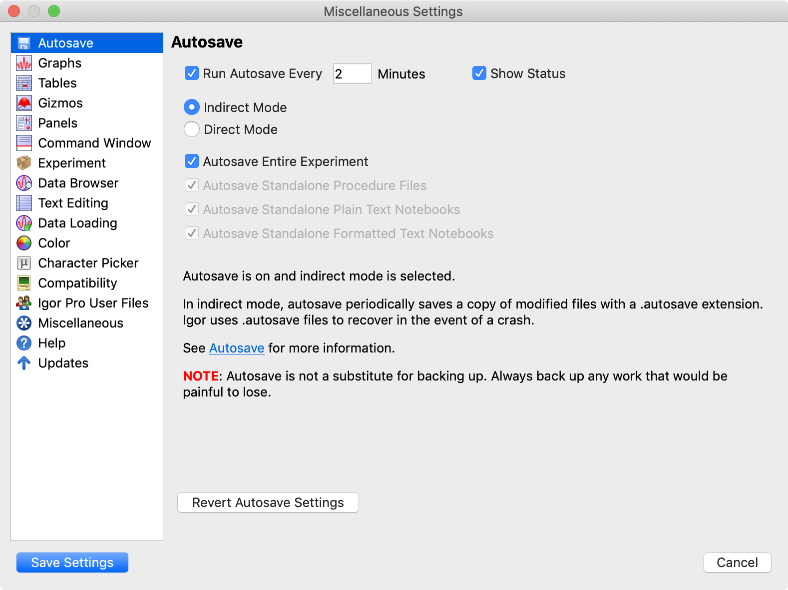
Prevent loss of work in the event of a crash or power loss by enabling Autosave from the Miscellaneous Settings dialog. You can set the frequency of saves and control whether autosave makes temporary backup copies of files or saves directly to open files.
HDF5
Entire Igor experiments can now be saved using the open HDF5 file format, making your data immediately accessible to a wide array of programs that support HDF5.
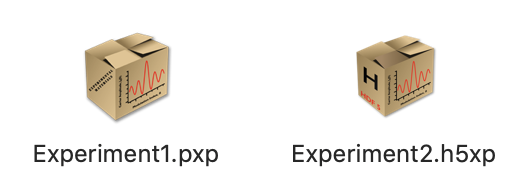
Igor also still fully supports the packed experiment format (.pxp) for backwards compatibility.
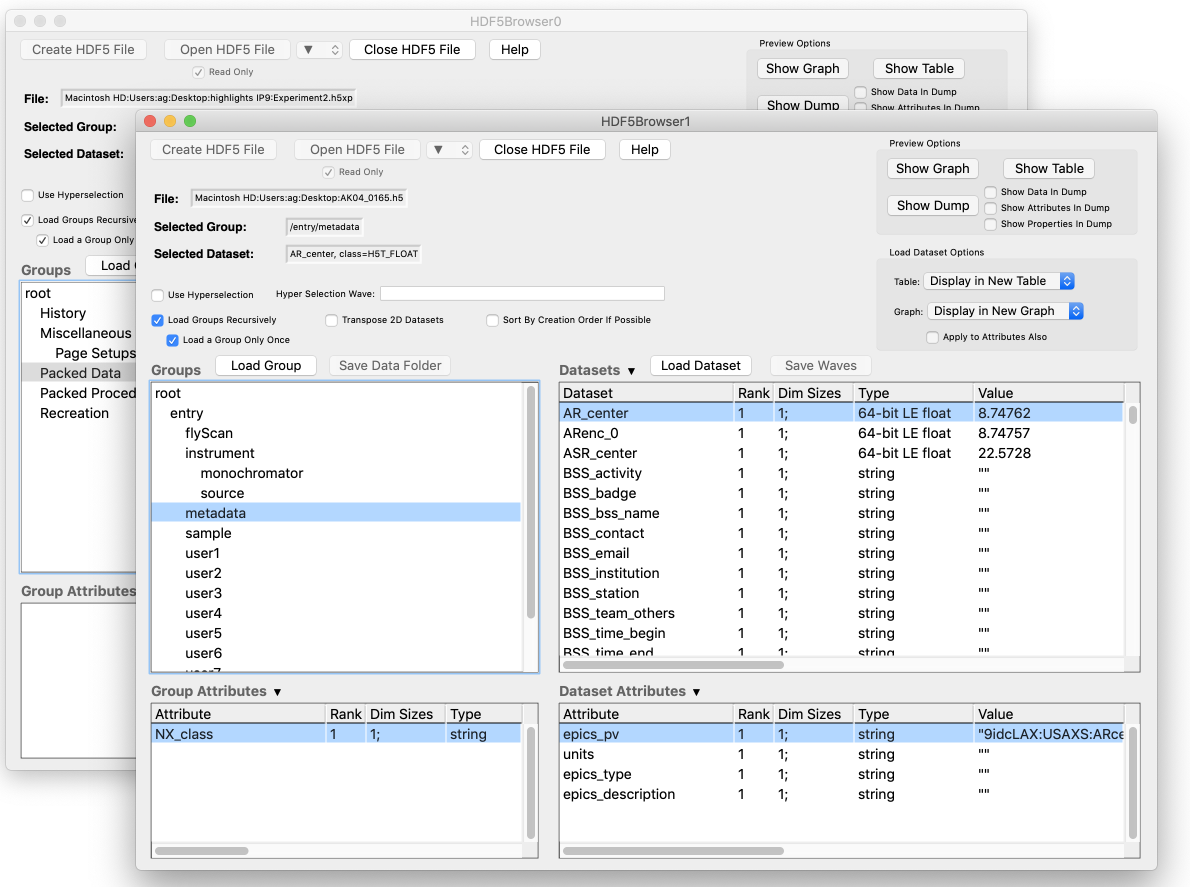
You can also open and browse multiple HDF5 files and convert the data into Igor native formats.
Improved PDF Export
Igor's PDF export now supports transparency and does a better job of font embedding.
User Interface
Drag and Drop
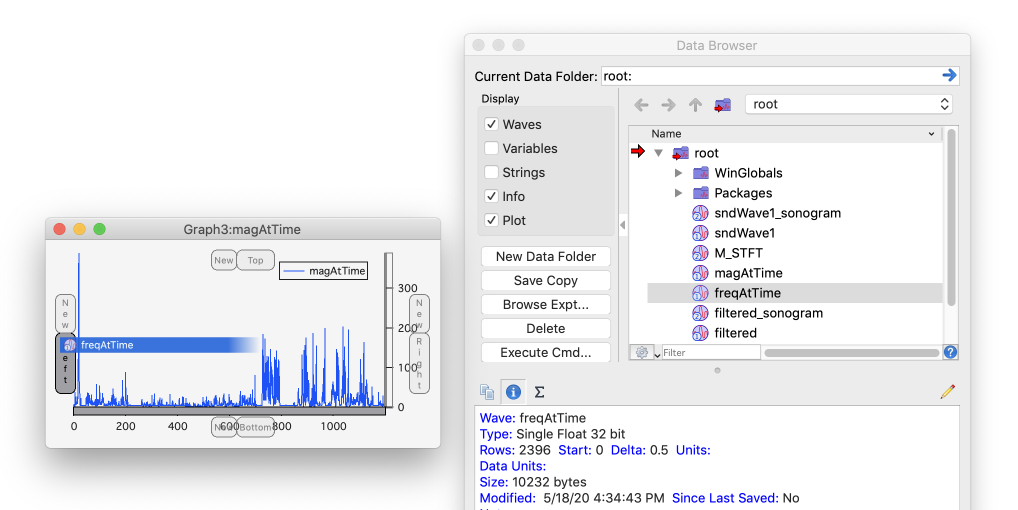
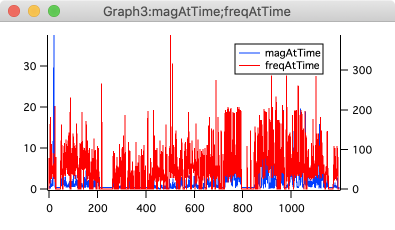
The ability to drag waves from the Data Browser onto a graph to make new traces has been enhanced. New active areas allow you to append traces to specific axes and to make new free axes, as well as select a wave as an X wave.
Control Panel Expansion
For those times when a user-defined panel is just a bit too small to read easily or a bit too big to fit your laptop's screen, you can make that panel bigger or smaller using the new Panel→Expansion submenu or the ModifyPanel expand command.
Before
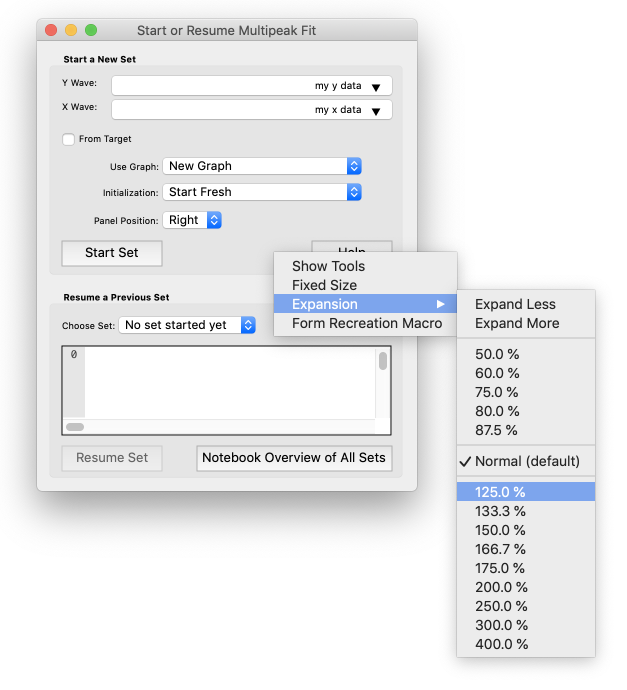
After
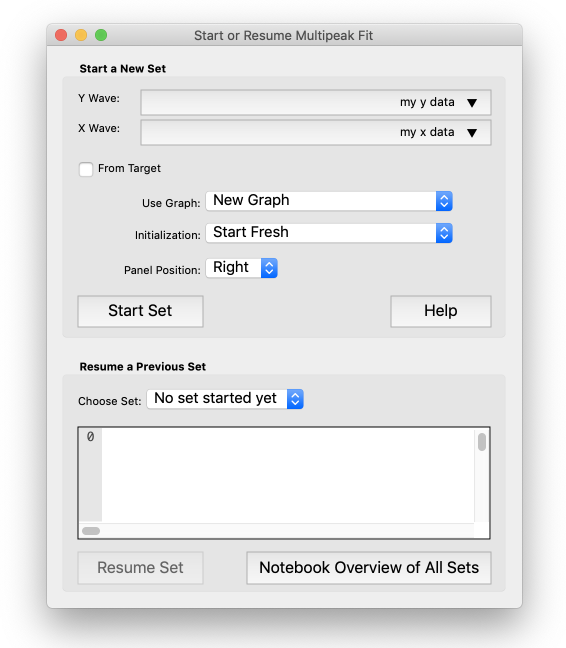
And if every user-defined panel needs expansion or reduction, you can set that scale factor in the Miscellaneous Settings dialog to apply to them all, which is useful when working on small laptop screens.
Note that an expansion other than 1.0 may present an alternate GUI appearance in order to maintain functionality.
Window Browser Improvements
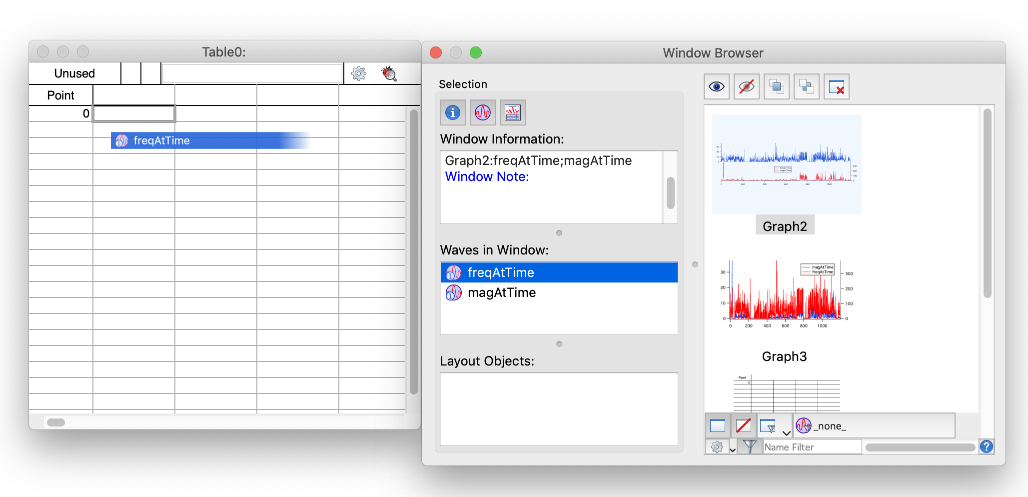
It is also now possible to drag waves onto graphs and tables from the Waves in Window list of the Window Browser:
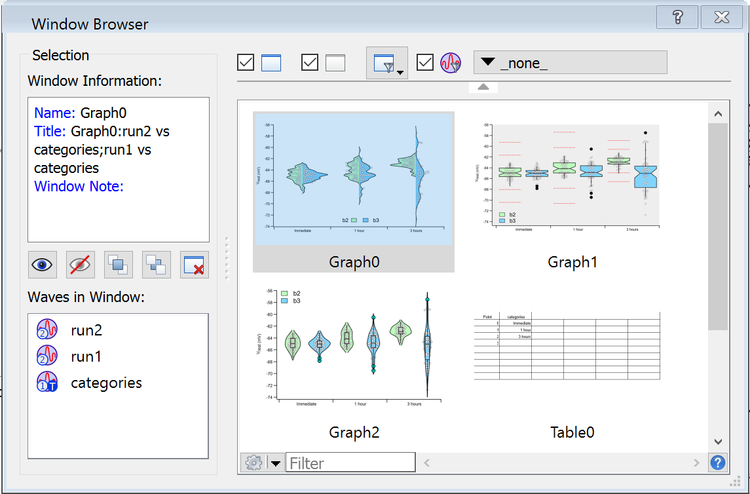
Window Browser Titles
The Window Browser and other dialogs that display lists of windows can now display titles of windows under or next to the window's icon instead of the name. Click the gear icon at the bottom of the window list and use the Display Text submenu to select Title.
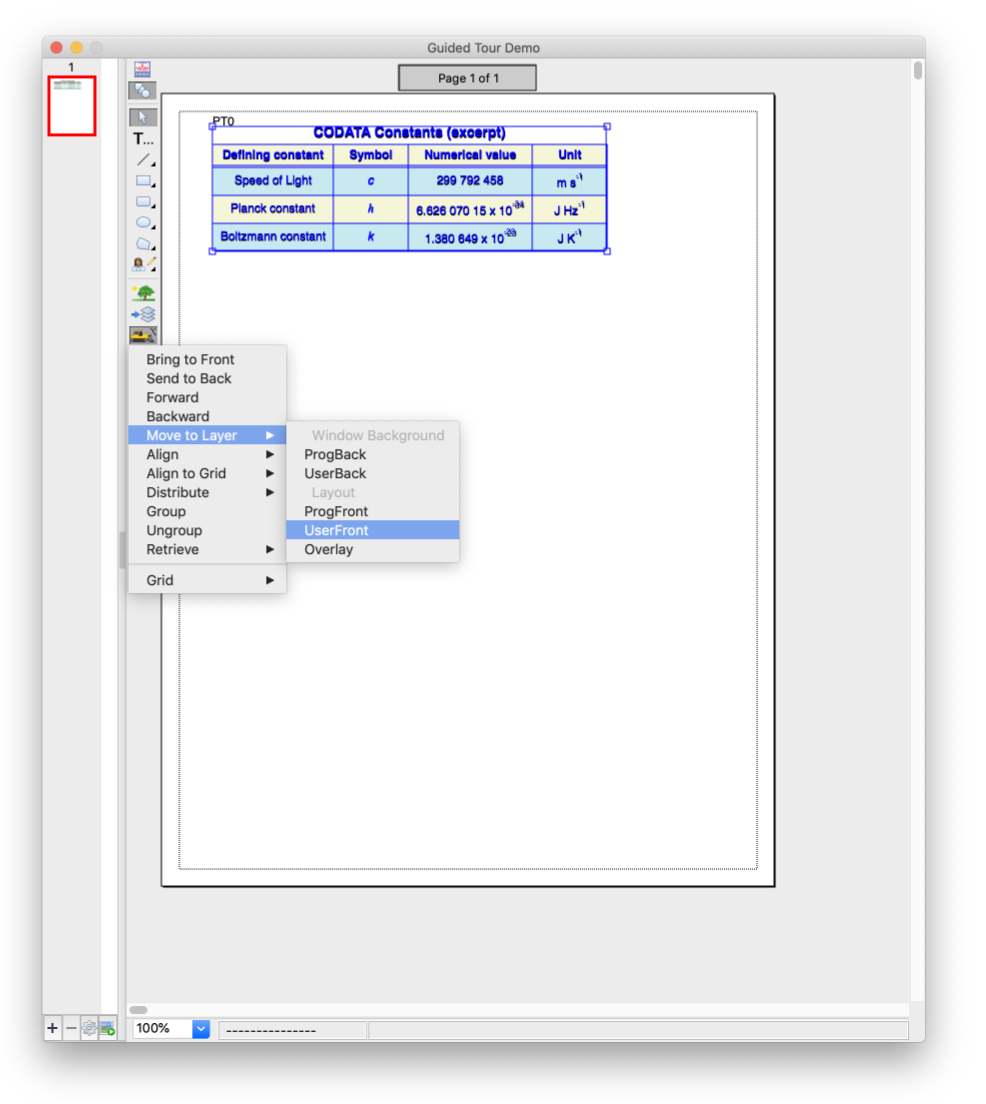
Move to Layer
Added a Move to Layer item to the draw tools palette and to the draw objects contextual menu. This streamlines what used to be a process of selecting, cutting, changing the draw layer and pasting if you wanted to change the draw layer of a drawing object.
Graphics
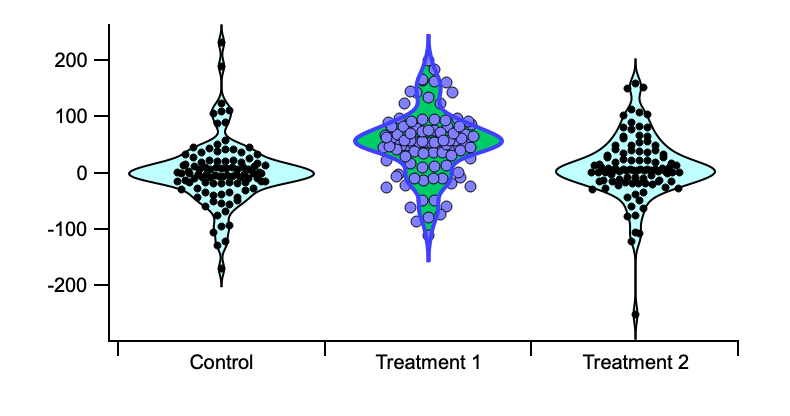
Box and Violin Plot per-dataset Properties
Box Plots and Violin Plots now support per-dataset settings. For instance, in a trace with several box plots, you can change the fill color of a single box. Previously, all the boxes or violins in a single trace had to look alike.
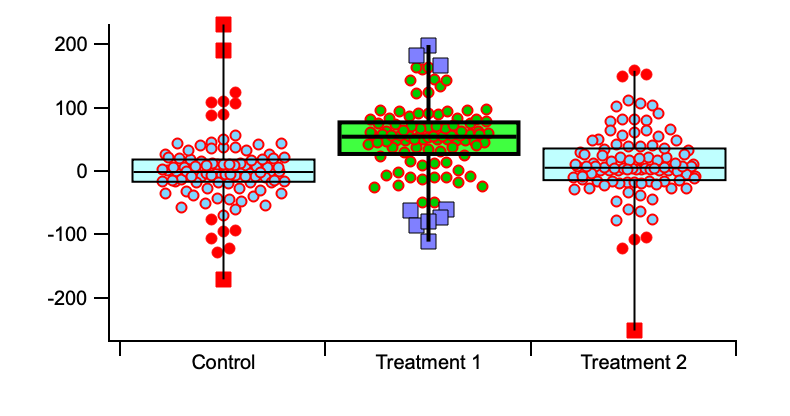
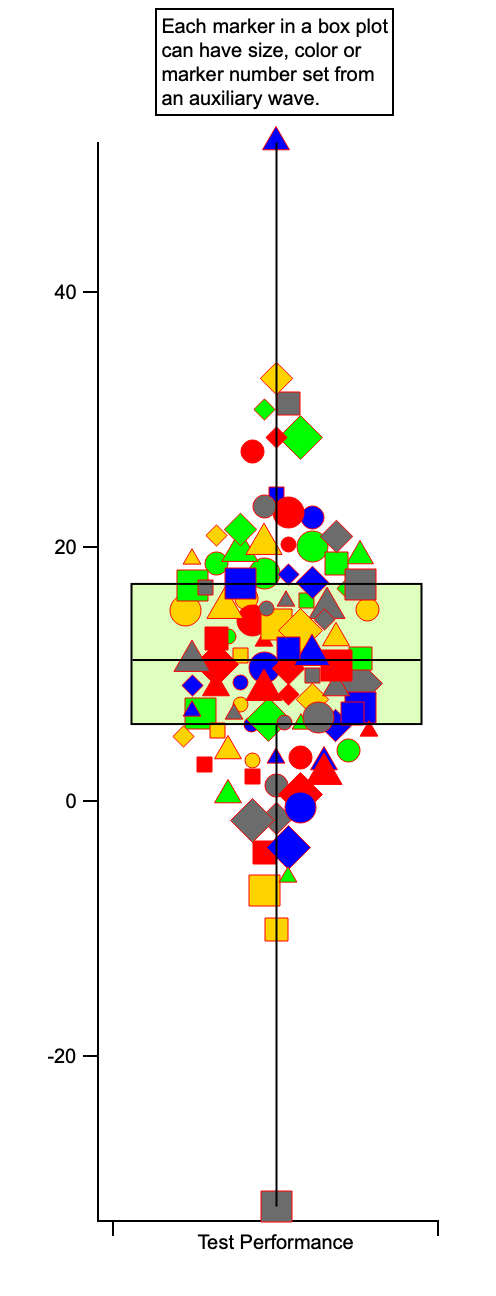
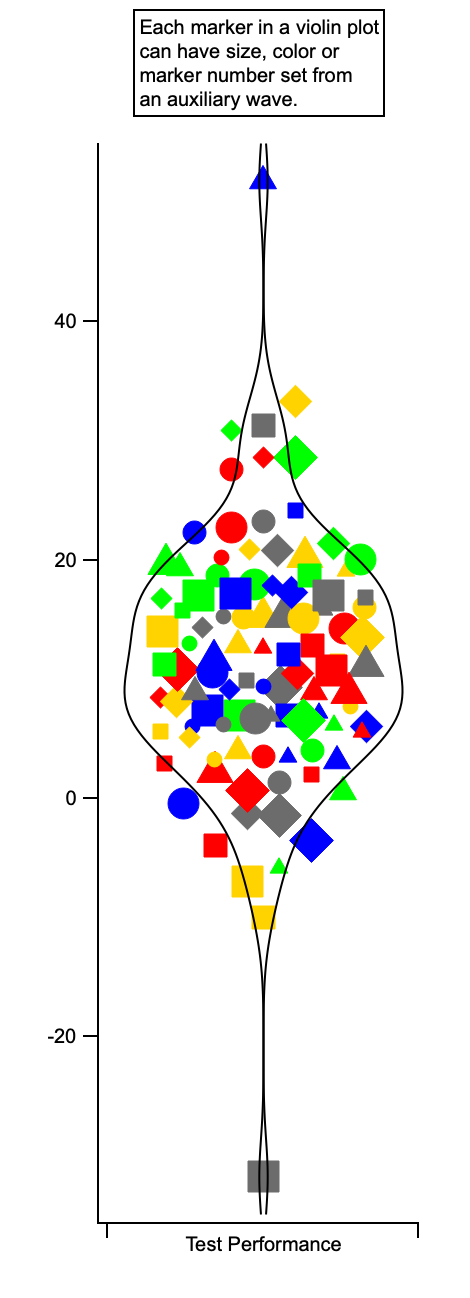
Box and Violin Plot Individual Datapoint Properties
Box Plots and Violin Plots now allow you to control the color, marker and marker size of each individual data point.
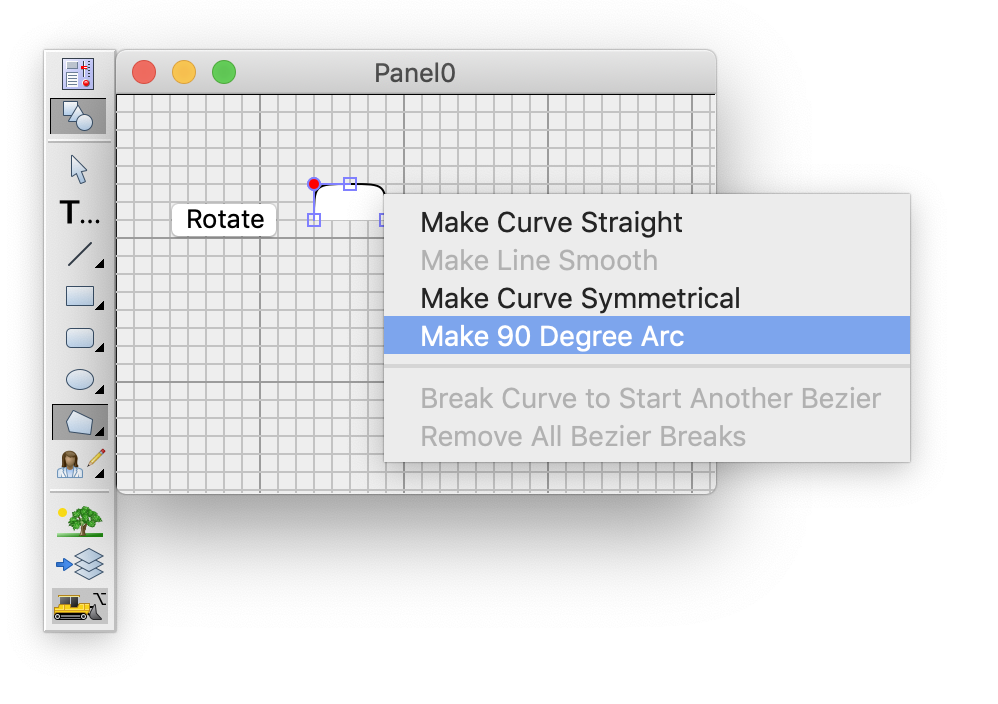
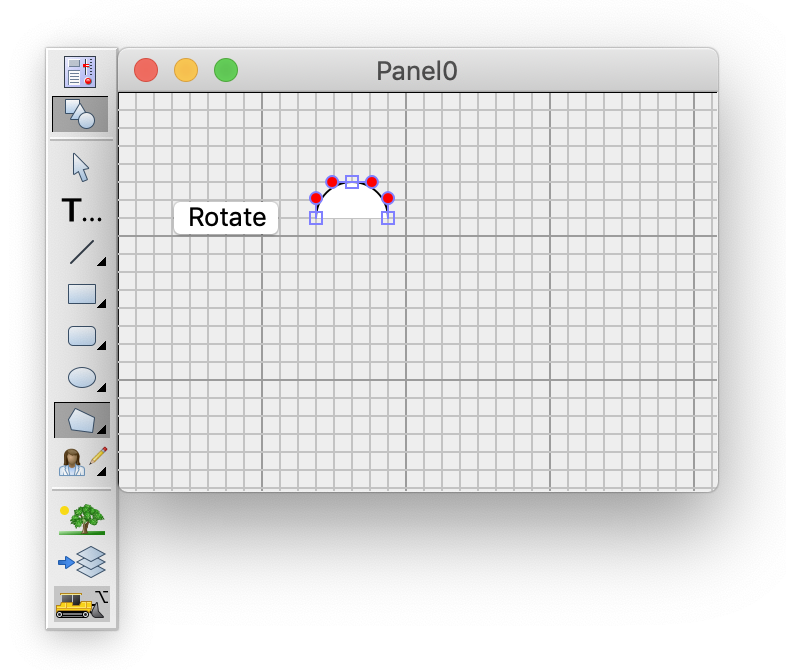
Improved editing of Polygons and Beziers
Editing of polygons and Bezier curves has been greatly improved, with better undo while drawing and better editing features such as snap to grid and contextual menus for shaping curves.
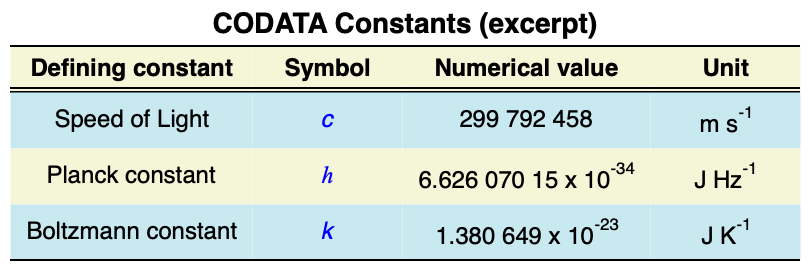
Presentation Table Procedures
This new package allows you to programmatically create a "presentation table" in a graph, layout or control panel window. The following table is an example produced in the Presentation Table Guided Tour:
Programming
Sparse Matrices
Some applications require manipulation of large matrices where most of the elements are zero. In these applications, the use of sparse matrices can improve performance and reduce memory utilization.
Igor supports sparse matrices through the MatrixSparse operation which was added in Igor Pro 9.00. It uses the Intel Math Kernel Library's Sparse BLAS routines and employs the library's terminology and conventions.
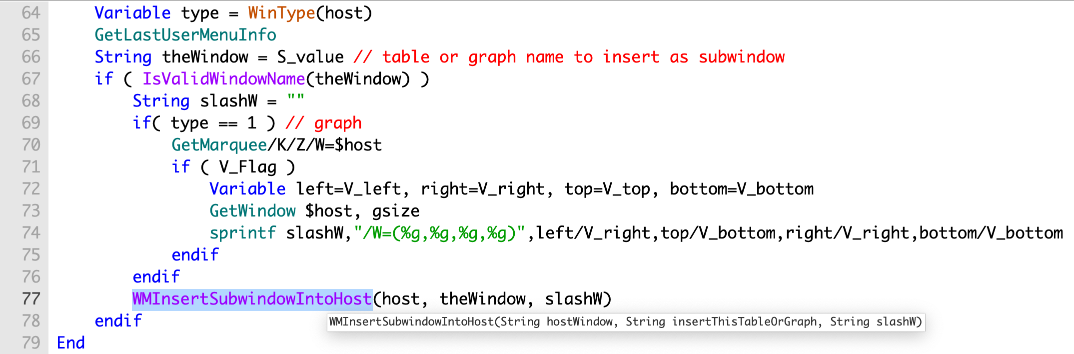
Command Tooltips and Completion
Command tooltips in procedure windows and the command line now includes user-defined functions.
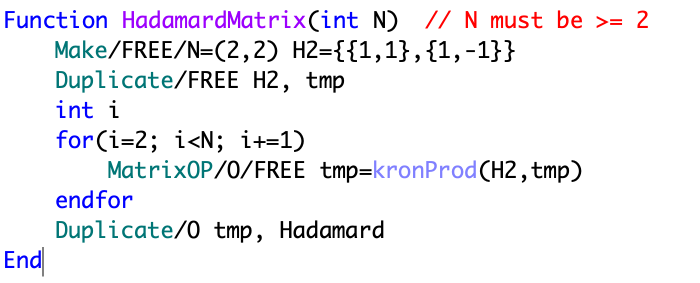
Syntax Highlighting Improvements
Syntax highlighting now includes MatrixOP and APMath functions:
Range-based For Loop
A range-based for loop iterates over all elements of a wave. The basic syntax is:
for(<type> varName : <wave expression>)
	<loop body>
endfor
For example:
 Function Example1()
  Make/O/T/N=(2,2) tw
  tw = "p="+num2str(p)+",q="+num2str(q)
  for (String str : tw)
    Print str
  endfor
End

•Example1()
  p=0,q=0
  p=1,q=0
  p=0,q=1
  p=1,q=1
24 New Functions
- AxisLabel
- centerOfMass
- centerOfMassXY
- CreateDataObjectName
- DataFolderList
- DataFolderRefChanges
- ellipticE
- ellipticK
- GeometricMean
- GetWindowBrowserSelection
- HDF5AttributeInfo
- HDF5DatasetInfo
- HDF5LibraryInfo
- HDF5LinkInfo
- HDF5TypeInfo
- MPFXEMGPeak
- MPFXExpConvExpPeak
- MPFXGaussPeak
- MPFXLorentzianPeak
- MPFXVoigtPeak
- ReplicateString
- StringToUnsignedByteWave
- WaveDataToString
- WaveMinAndMax
34 New Operations
- BezierToPolygon
- HCluster
- HDF5CloseFile
- HDF5CloseGroup
- HDF5Control
- HDF5CreateFile
- HDF5CreateGroup
- HDF5CreateLink
- HDF5DimensionScale
- HDF5Dump
- HDF5DumpErrors
- HDF5FlushFile
- HDF5ListAttributes
- HDF5ListGroup
- HDF5LoadData
- HDF5LoadGroup
- HDF5LoadImage
- HDF5OpenFile
- HDF5OpenGroup
- HDF5SaveData
- HDF5SaveGroup
- HDF5SaveImage
- HDF5UnlinkObject
- InstantFrequency
- MatrixBalance
- MatrixFactor
- MatrixMultiplyAdd
- MatrixReverseBalance
- MatrixSparse
- PolygonOp
- TextHistogram
- Text2Bezier
- UnzipFile
- WaveTracking
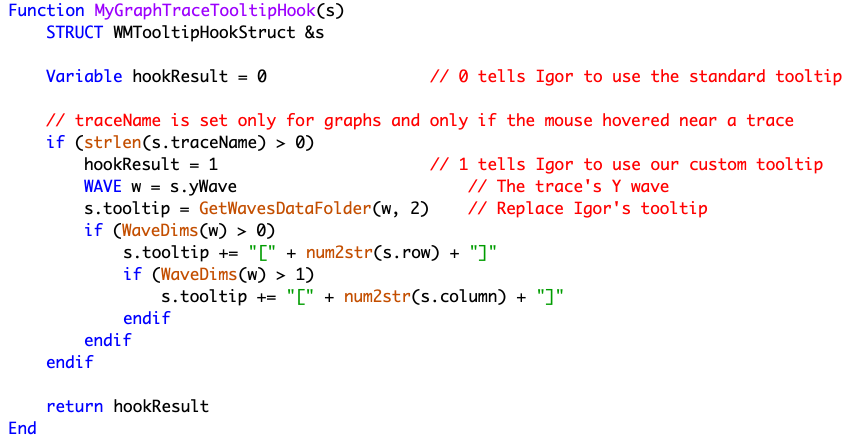
Tooltip Hooks
Igor 9 adds tooltip hook functions so that an Igor programmer can provide a tooltip for any arbitrary rectangle in a window. This example code shows the index of the trace's wave at the mouse position:
Data Analysis
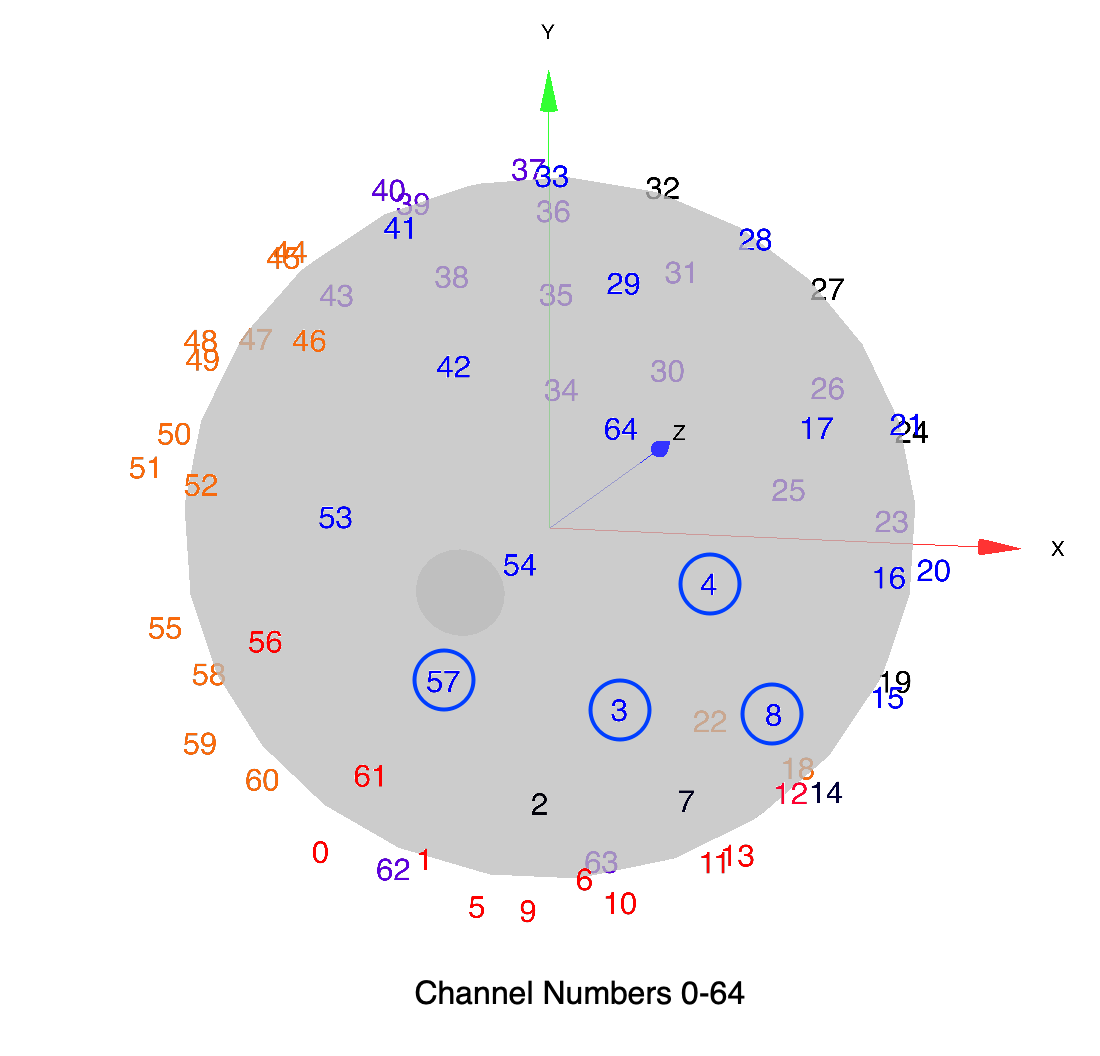
Hierarchical Cluster Analysis
Added new HCluster operation that performs agglomerative hierarchical cluster analysis. The input can be either a matrix in which rows represent vectors in a data space, or a square distance matrix giving the distance or dissimilarity between pairs of vectors. Output is a distance matrix if you start with a vector matrix, and/or a wave containing information needed to draw a hierarchical dendrogram.
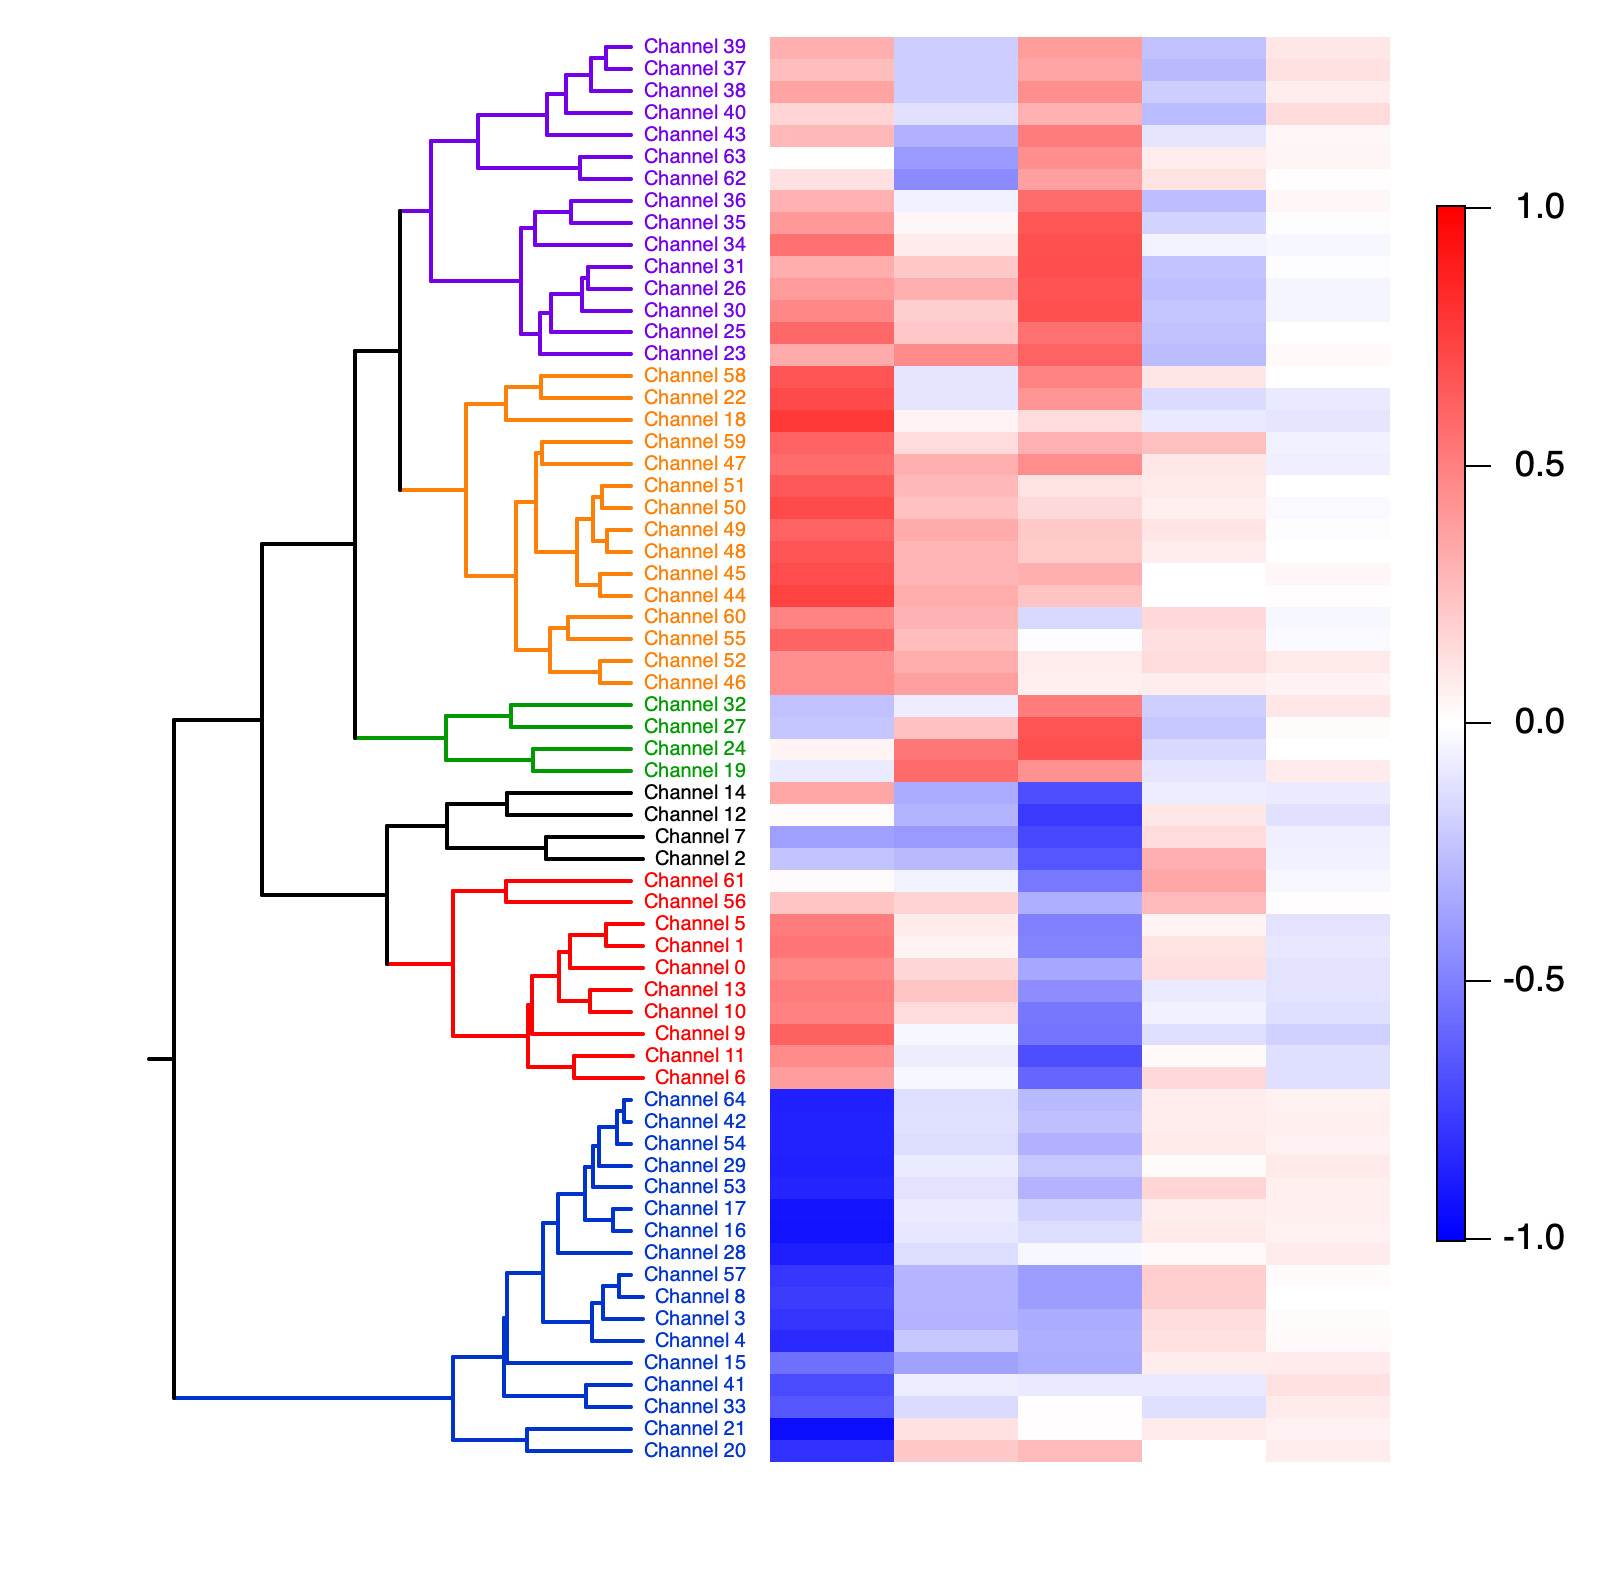
This example shows the hierarchical clustering of EEG electrode sites/channels. The 65 sites are distributed across the scalp. The clustering analysis following PCA shows that adjacent sites are often clustered together. For example, the right frontal 3,4,8,57 sites (blue sub-branch) are highly correlated. The anterior sites (above the nasion) cluster together (red). Inferior sites (the outside concentric circle) are in orange.
Complex Curve Fitting Functions
Curve Fitting now supports fitting to complex functions.
(Prior to Igor Pro 9.00, to fit complex-valued functions to complex-valued data required writing a real-valued fit function that used a special organization of the data to pack real and imaginary parts into a single real-valued wave.)
Multipeak Fitting
- Extensive improvements to the GUI
- New peak shapes: DoniachSunjic, PCI (Post-Collision Interaction)
- New versions of standard peak shapes with physically meaningful fit coefficients like Area
- A Voigt peak with Gauss and Lorenzian FWHM instead of that annoying "shape factor"
- New baseline functions: ArcTan, Shirley, Tougaard
- Created a GUI for the AutoMPFit() function, allowing easier access to batch multipeak fitting
- Many bug fixes
Thanks to the hard work and generosity of Igor power user Stephan Thürmer for these and many other improvements.
Performance Improvements
- Windows: Improved performance of text parsing when loading text data and compiling. Also improved performance of commands that access files when called from multiple threads.
- Faster procedure compile time.
- Improved text processing performance.
- Added automatic multithreading in CWT, ImageRegistration, Interp3DPath, norm and ImageFilter.
- Added functions vectorization and optimized memory allocation in MatrixOP.

Forum

Support

Gallery
Igor Pro 10
Learn More
Igor XOP Toolkit
Learn More
Igor NIDAQ Tools MX
Learn More