Paths
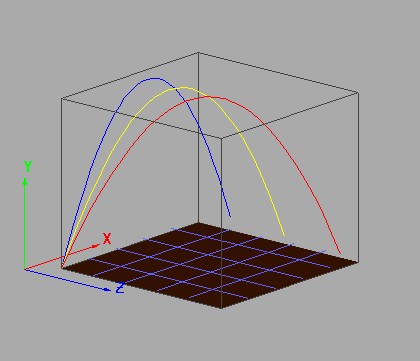
Path plots are used to represent an ordered set of 3D points as in the red, yellow and blue paths below. The paths represent computed trajectories of projectiles in the presence of cross wind.
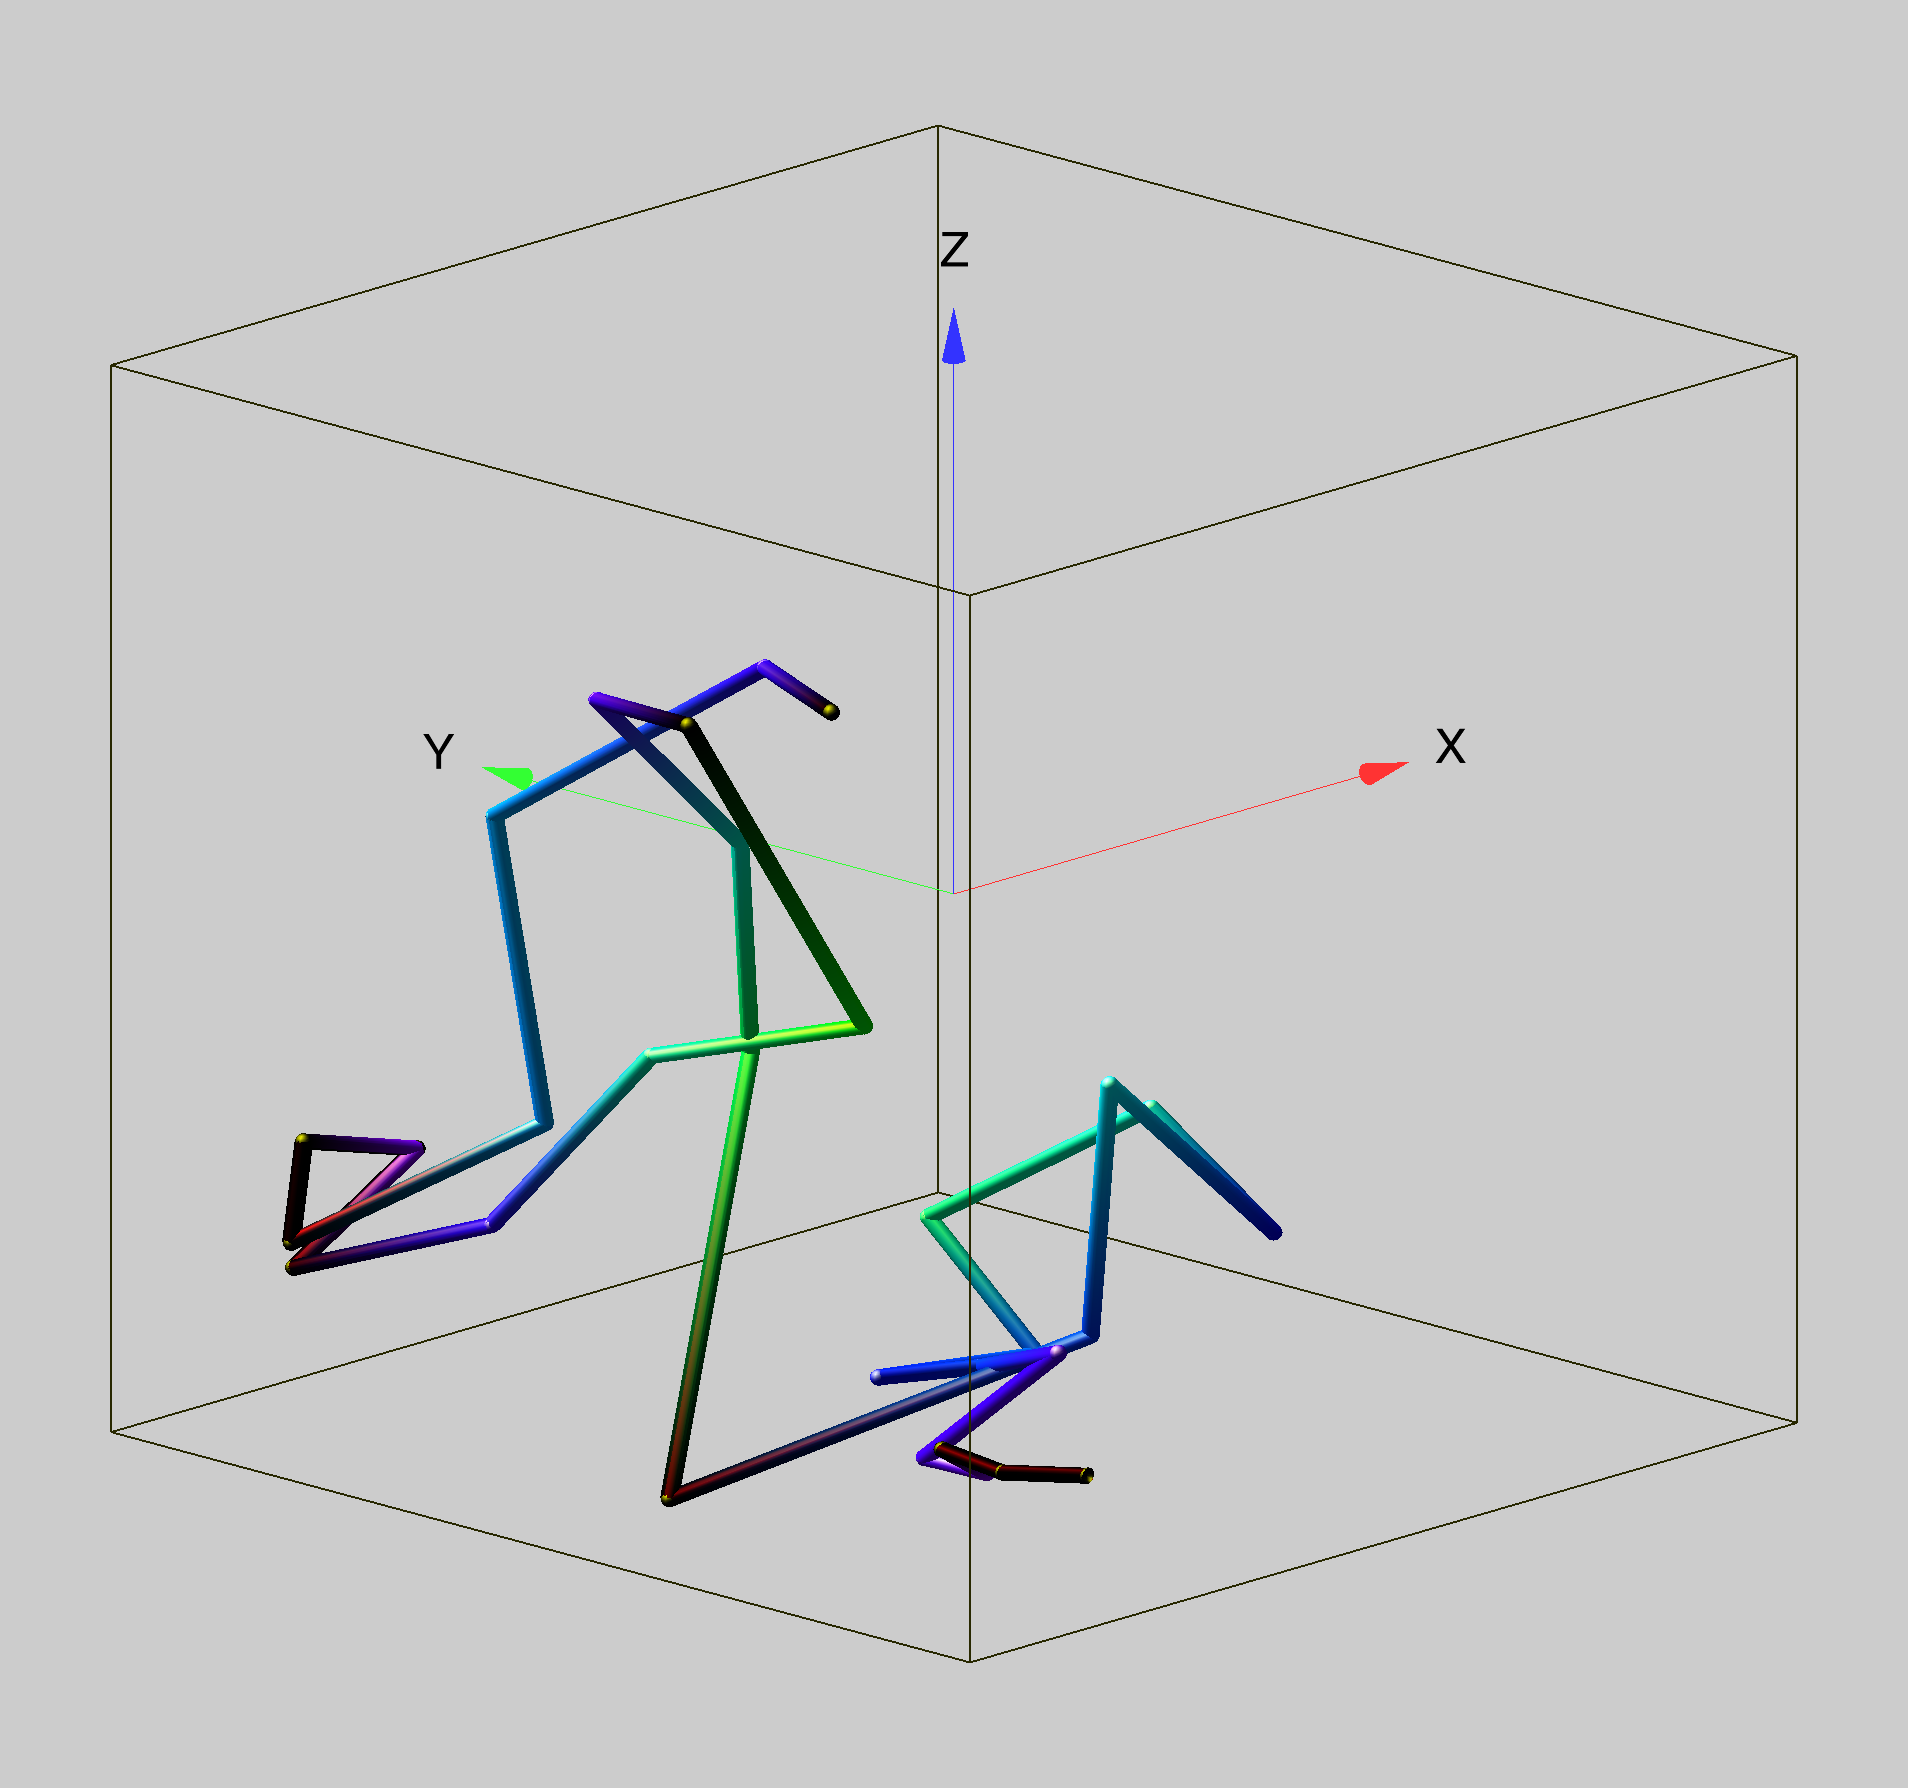
In the following path plot we show a 3D random walk where the the RGB components of the path color represent the relative magnitude of change in position in the X, Y and Z directions respectively.
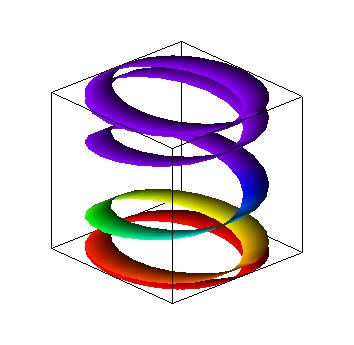
Ribbon Plots
Ribbon plots are similar to drawing two path plots of N points each and connecting the two paths by a sheet made of N triangles.
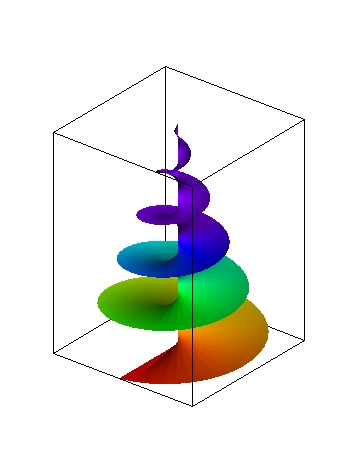
The ribbon does not have to be of a constant width. The following example illustrates a ribbon with tapering width.

Forum

Support

Gallery
Igor Pro 10
Learn More
Igor XOP Toolkit
Learn More
Igor NIDAQ Tools MX
Learn More