Igor Pro®’s drawing tools are useful in page layout and graph windows for highlighting material with boxes, circles and arrows and can also be used to create diagrams. These drawing tools are object-oriented and optimized for the creation of publication quality graphics. All line sizes and object coordinates can be specified using real numbers. For example you can specify that a line thickness be 0.76 points.
You can graphically edit a wave’s data values when it is displayed in a graph; data points can be deleted, added or modified. You can also create new waves by simply drawing them. In control panel windows, you can use the drawing tools to create a fancy background for controls.
Like all other aspects of Igor, drawing tools are fully programmable. This allows programmers to create packages of code that add new graph types to Igor’s repertoire. Although only programmers can create such packages, everyone can make use of them. The drawing tools are available in page layout, graph and control panel windows.
The drawing tool palete includes:
- Arrow tool for selecting, moving and resizing objects.
- Simple text
- Lines and arrows
- Rectangle
- Rounded rectangle
- Oval and arc
- Polygon and Bezier. The Polygon tool is also used when graphically editing data.
- Draw environment for changing properties such as line thickness, color, fill pattern, and other visual attributes.
- Drawing layer selection.
- Alignment for adjusting the drawing order, object positions, group and ungroup objects, and perform other object movement tasks.
Polygon and Bezier objects can use dashed lines, have a fill color and pattern and can have arrow heads.
Double-clicking on an object leads to a dialog where the object’s properties can be adjusted.
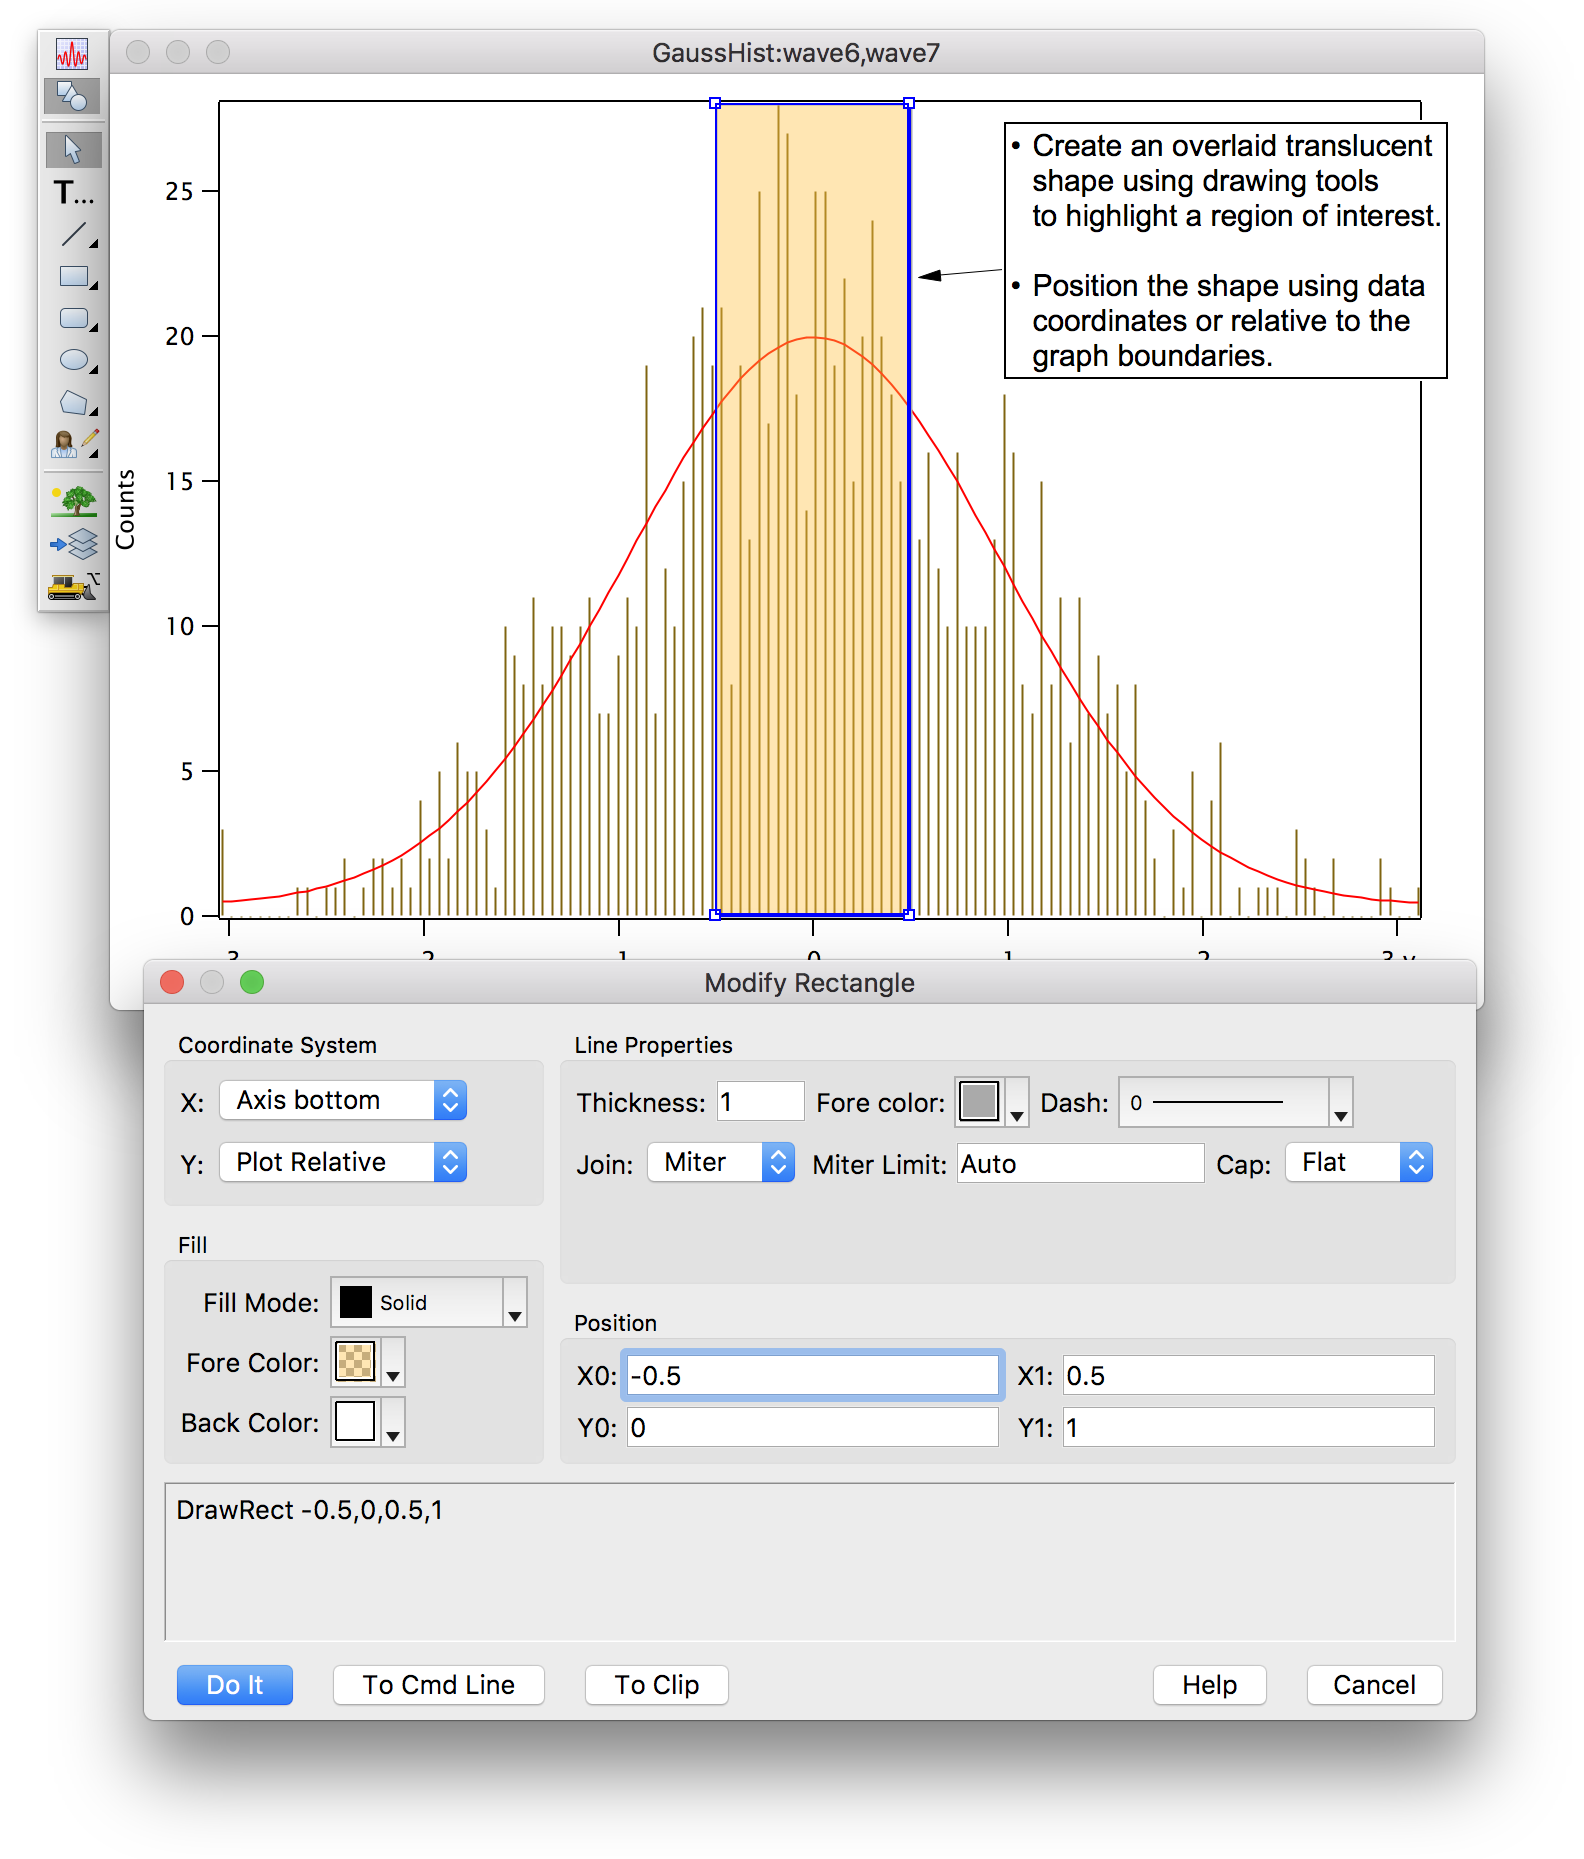
Coordinate Systems
A unique feature of Igor’s drawing tools is the ability to choose different coordinate systems. You can choose different systems on an object-by-object basis and for X and Y independently. This capability is especially useful in graphs to allow your drawings to adjust to changes in window size or to changes in axis scaling. Coordinate systems include:
- Absolute: coordinates are measured in points relative to the top-left corner of the window.
- Relative: coordinates are measured as fractions of the size of the window.
- Plot Relative (Graphs Only): like Relative except it is based on the plot rectangle rather than the window rectangle.
- Axis-Based (Graphs Only): position on screen is calculated just as it is for data plotted against that axis.
Layers
Layers allow you to control the front-to-back layering of drawing objects relative to other window components. For example, if you want to demarcate a region of interest in a graph, you can draw a shaded rectangle into a layer behind the graph traces.
Each window type supports a number of separate drawing layers. For example, in graphs Igor provides seven drawing layers:
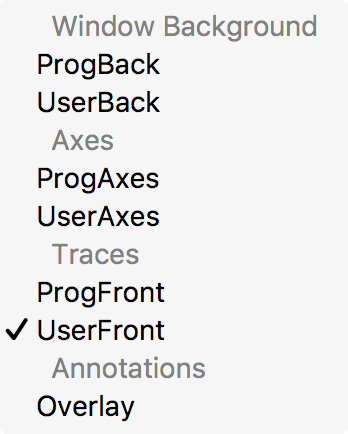
The drawing layers (ProgBack, UserBack, ProgAxes, UserAxes, ProgFront, UserFront, and Overlay) are listed top-to-bottom in back-to-front drawing order, and show their layering with respect to other elements of the graph.
Separate layers are provided for user drawings and for programmatically created drawings.

Forum

Support

Gallery
Igor Pro 10
Learn More
Igor XOP Toolkit
Learn More
Igor NIDAQ Tools MX
Learn More