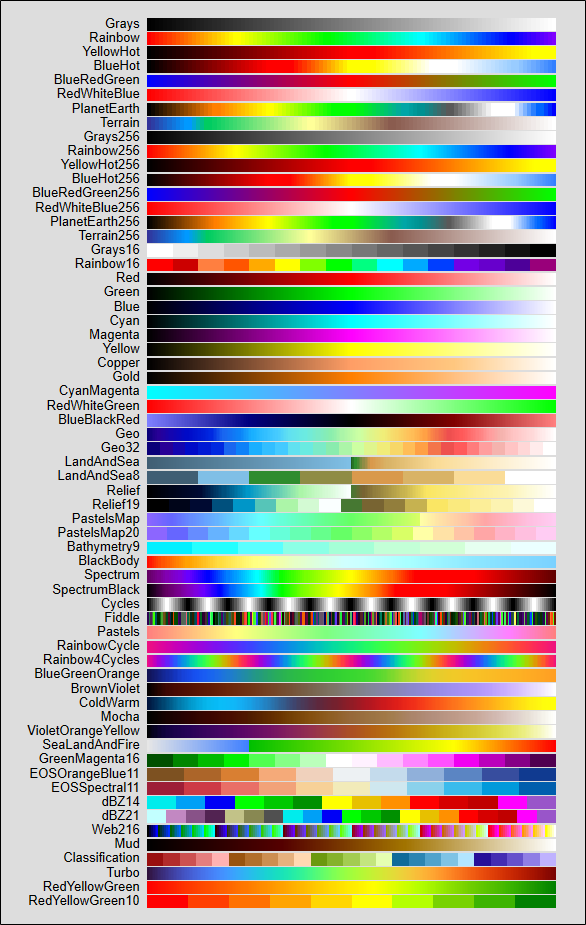
Igor Pro® 10 has 63 built-in color tables for use with false color images, contour plots, and graph traces.
Color Table Ranges
The range of data values that maps into the range of colors in the table can be set either manually or automatically using the Modify Image Appearance dialog.
When you choose to autoscale the first or last color, Igor examines the data in your image and uses, respectively, the minimum or maximum data values found.
By changing the "First Color at Z=" and "Last Color at Z=" values you can examine details in your data.
For example, when using the Grays color table, you can lighten the image by assigning the First Color (which is black) to a number lower than the image minimum value. This maps a lighter color to the minimum image value. To darken the maximum image values, assign the Last Color to a number higher than the image maximum value, mapping a darker color to the maximum image value.
Data values greater than the range maximum are given the last color in the color table, or they can all be assigned to a single color or made transparent. Similarly, data values less than the range minimum are given the first color in the color table, or they can all be assigned to a single color (possibly different from the max color), or made transparent.
Some of the color tables are designed for specific uses and specific numeric ranges.
The BlackBody color table is designed to show the color of a heated "black body" (though not the brightness of that body) over the temperature range of 1,000 to 10,000 degrees Kelvin.
The Spectrum color table is designed to show the color corresponding to the wavelength of visible light as measured in nanometers over the range of 380 to 780 nm.
The SpectrumBlack color table does the same thing, but over the range of 355 to 830 nm. The fading to black is an attempt to indicate that the human eye loses the ability to perceive colors at the range extremities.
The dBZ14 and dBZ21 color table are designed for displaying weather maps using standard National Weather Service radar colors and values.
The LandAndSea, SeaLandAndFire, Relief, and PastelsMap color tables all have a sharp color transition which is intended to denote sea level.
The LandAndSea and Relief tables have this transition at 50% of the range. You can put this transition at a value of 0 by setting the minimum value to the negative of the maximum value:
ModifyImage imageName, ctab={-1000,1000,LandAndSea,0}	// image plot
ColorScale/C/N=scale0  ctab={-1000,1000,LandAndSea,0}	// colorscale
The PastelsMap table has this transition at 2/3 of the range. You can put this transition at a value of 0 by setting the minimum value to twice the negative of the maximum value:
ModifyImage imageName, ctab={-2000,1000,PastelsMap,0}	// image plot
ColorScale/C/N=scale0  ctab={-2000,1000,PastelsMap,0}	// colorscale
This principle can be extended to the other color tables to position a specific color to a desired value. Some trial-and-error is to be expected.
Note: The BlackBody, Spectrum, and SpectrumBlack color tables are based on algorithms from the Color Science web site.
Reference: Wyszecki, Gunter, and W. S. Stiles, Color Science : Concepts and Methods, Quantitative Data and Formula, 628 pp., John Wiley & Sons, 1982.
Color Table Waves
You can use 3 of 4 column waves as color tables to provide any color table you can imagine or import.
Unlike a color index wave where the image wave data value is used as an X index into the color index wave to select the color for a given point, aa color table wave uses the image wave's full range of data values, or a range that you explicitly specify to map to the entire color table wave or a specified range.
The resultant color depends on the data value and the operative range only, not on the color table wave's X scaling.
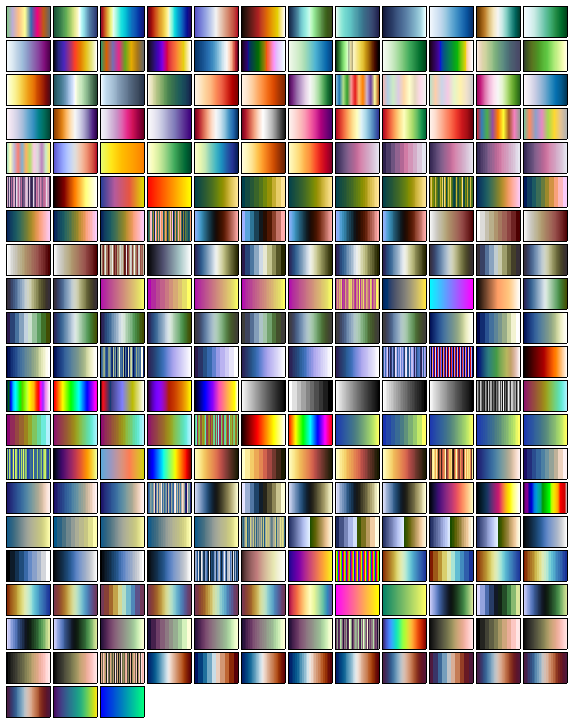
Provided Color Table Waves
Igor Pro 10 already ships with a large number of color table waves as Igor binary files in the Igor Pro Folder's Color Tables folder, to which you can add your own:
- EPFL Color Schemes
- LANL Color Maps
- Matplotlib Color Maps
- Moreland Color Maps
- Misc Color Schemes
- Scientific Colour Maps (Version 6.0.4)

Forum

Support

Gallery
Igor Pro 10
Learn More
Igor XOP Toolkit
Learn More
Igor NIDAQ Tools MX
Learn More