Annotations are custom objects that add information to a graph or a page layout. Most annotations contain text that you might use to describe the contents of a graph, point out a feature of a wave, identify the axis that applies to a wave, or create a legend. Igor Pro® automatically creates annotations for labeling contour plots. An annotation can also contain a color scales showing the data range associated with colors in contour and image plots.
There are four types of annotation: textboxes, legends, color scales, and tags.
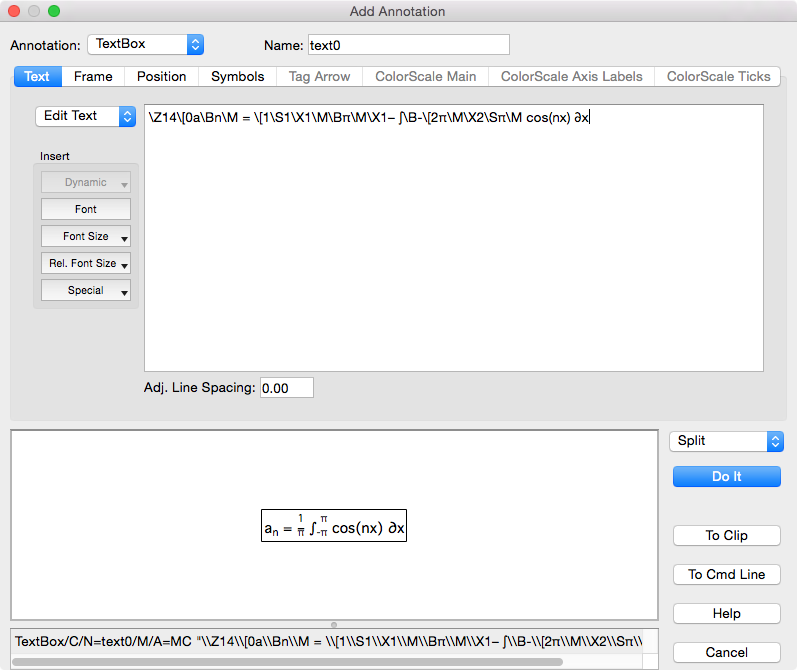
A textbox contains one or more lines of text which optionally may be surrounded by a frame, freely rotated, colorized and aligned. You can also insert pictures (including PDF on Mac) in-line with the text — handy for inserting complex math expressions from other applications.
A legend is similar to a textbox except that it contains wave symbols for one or more waves in a graph. Legends are automatically updated when waves are added to or removed from the graph, or when a wave's appearance is modified.
A tag is also similar to a textbox except that it is attached to a point in a wave and can contain dynamically updated text describing that point. In contour plots, Igor automatically generates tags to label the contour lines.
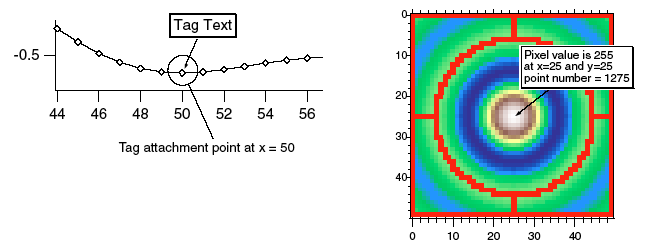
Tags can use free rotation and can be designated to automatically rotate tangent to the attachment point or snap to 90 degree increments.
A color scale is similar to a legend except that it contains a color bar with an axis that spans the range of colors associated with the data.
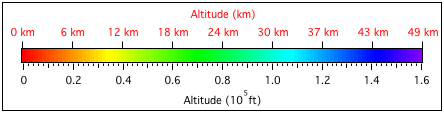
Color scales are automatically updated when the associated image plot, contour plot, f(z) trace, or color index wave is modified. A color scale can also be completely disassociated from any data by directly specifying a named color table and an explicit numeric range for the axis.
Dynamic Escape Codes
You can insert special codes in tags and text boxes that tell Igor to insert information at that point. In tags, you can insert data set names, x or y values, offset values and the attachment point. In either tags or textboxes, you can insert dynamic numeric or string expressions. If your expression references a data object, Igor will automatically update the annotation if the object changes.
Moving a tag to a different anchor point or changing a wave's data values will cause the tag to automatically update.

Forum

Support

Gallery
Igor Pro 10
Learn More
Igor XOP Toolkit
Learn More
Igor NIDAQ Tools MX
Learn More