The ImageLineProfile operation provides sampling of a source image along an arbitrary path which consists of line segments between every two consecutive user-specified vertices.
In each segment the profile is calculated at a number of points (profile points) equivalent to the sampling density of the original image.
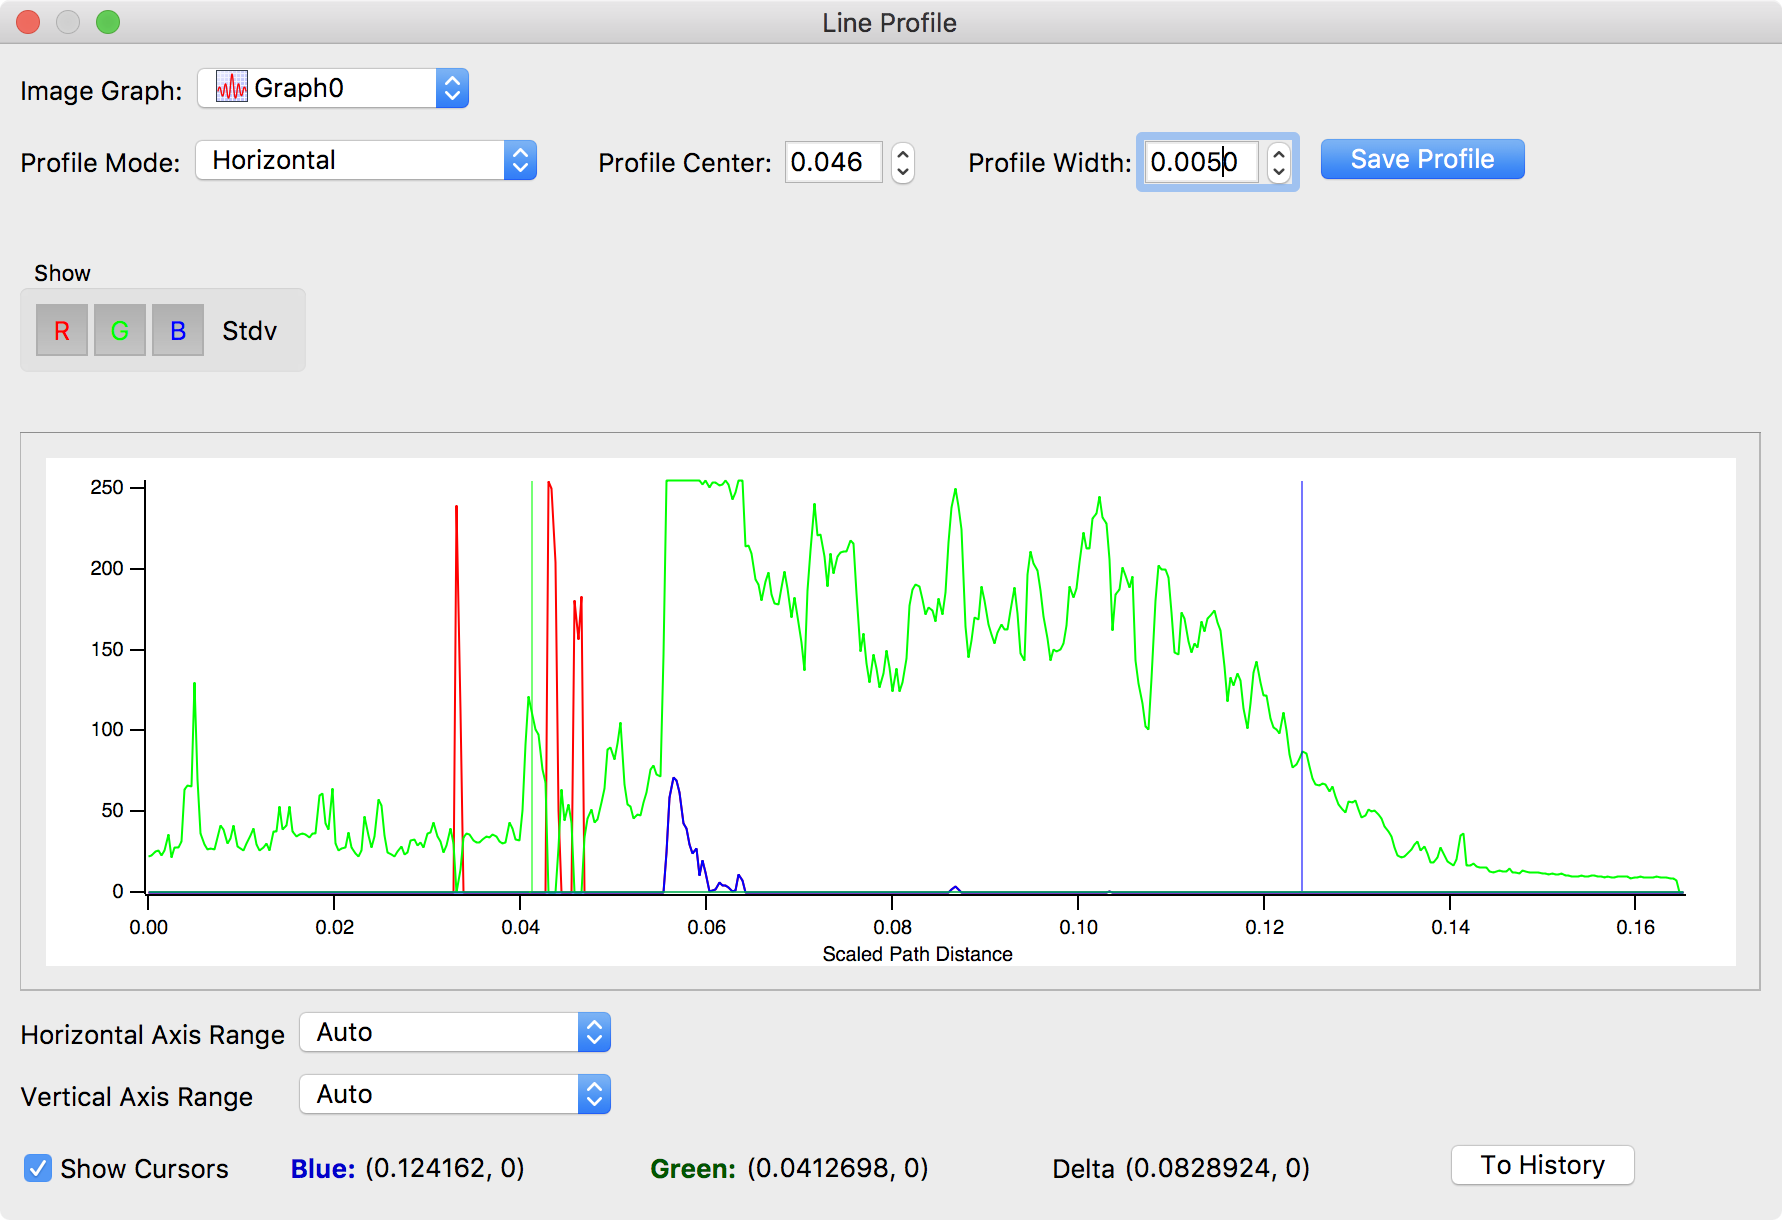
At each profile point the profile value is calculated by averaging samples along the normal to the profile line segment. You can specify the number of samples in the average with the Profile Width setting.
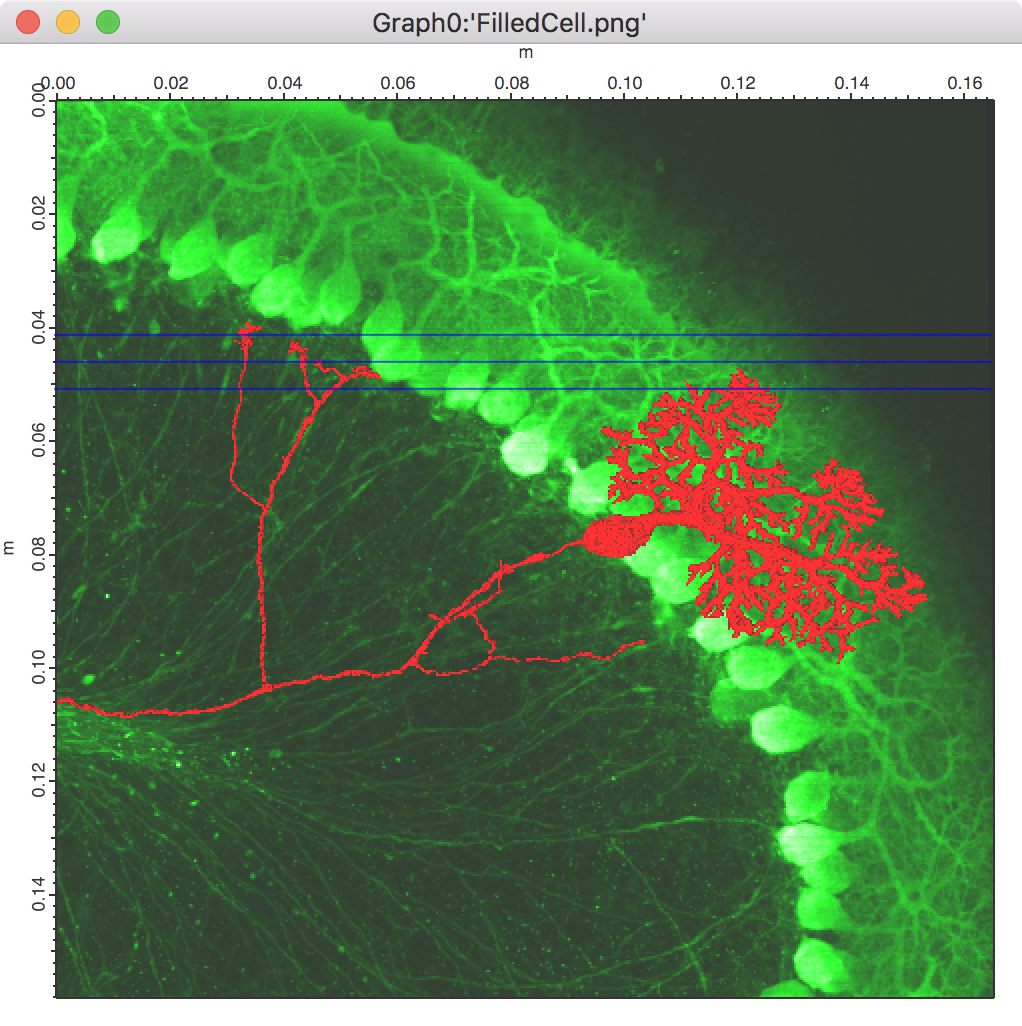
The profile is measured along the blue path. In this example the path consists of a single line segment whose width is indicated by the top and bottom blue lines.
The line profile shows the individual RGB components along the specified path.

Forum

Support

Gallery
Igor Pro 10
Learn More
Igor XOP Toolkit
Learn More
Igor NIDAQ Tools MX
Learn More