Tables
Tables are useful for entering, modifying or inspecting waves. You can also use a table for presentation purposes by exporting it to another program as a picture or by including it in a page layout.
If your data has a small number of points you will probably find it most convenient to enter it in a table. In this case, creating a new empty table will be your first step.
If your data has a large number of points you will most likely load it into Igor Pro® from a file. In this case it is not necessary to make a table. However, you may want to display the waves in a table to inspect them.
A table in Igor Pro® is similar to but not identical to a spreadsheet in other graphing programs. The main difference is that in Igor data exists independently of the table. You can create new waves in Igor’s memory by entering data in a table. Once you have entered your data, you may, if you wish, kill the table. The waves exist independently in memory so killing the table does not kill the waves. You can still display them in a graph or in a new table.
You can edit multi-dimensional data in a table. A popup menu lets you change which pair of dimensions are presented in the table.
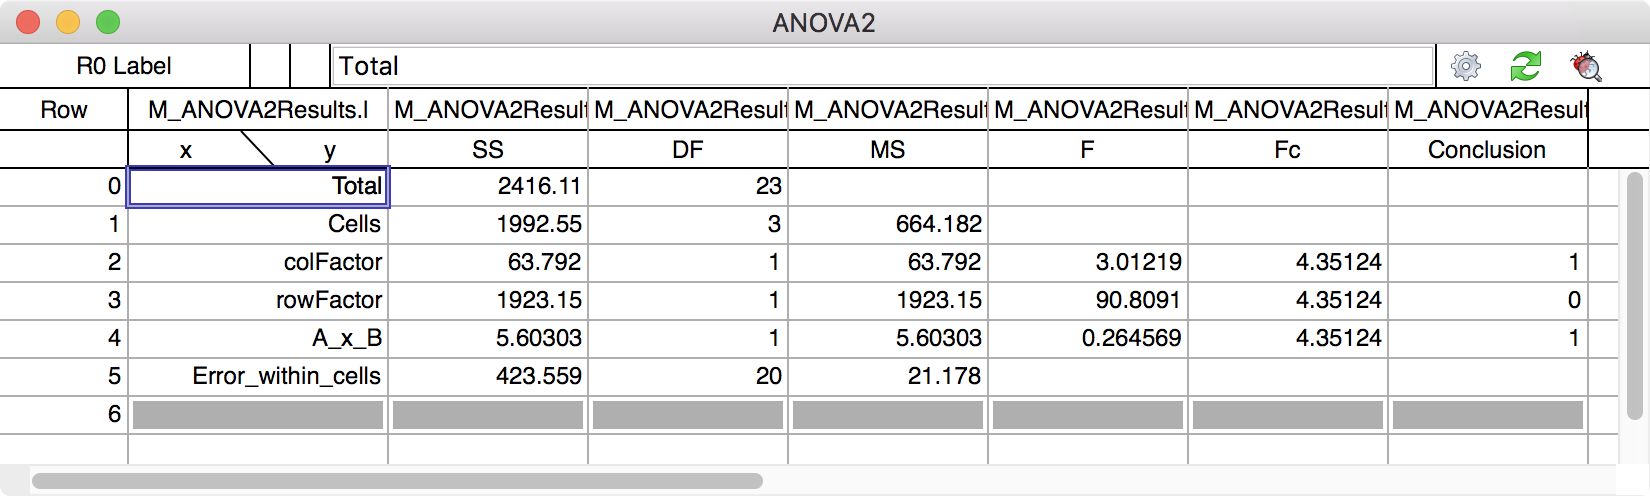
Here is an example of a table showing a 2D wave with dimension labels.

Forum

Support

Gallery
Igor Pro 10
Learn More
Igor XOP Toolkit
Learn More
Igor NIDAQ Tools MX
Learn More