Igor Pro® from WaveMetrics®
Technical graphing and data analysis software for scientists and engineers
Buy or Upgrade IgorTry It NowBrochureUsed in leading research institutes, universities and industries throughout the world.
Leading Analysis Software
Igor Pro offers a complete software solution that's powerful yet agile, giving you the power to visualize, analyze and share your data like never before.
Flexible Purchase Options
Choose from three convenient purchasing options to select a license that's right for your needs: Standard, Academic, or Student.
A Complete Scientific Toolset
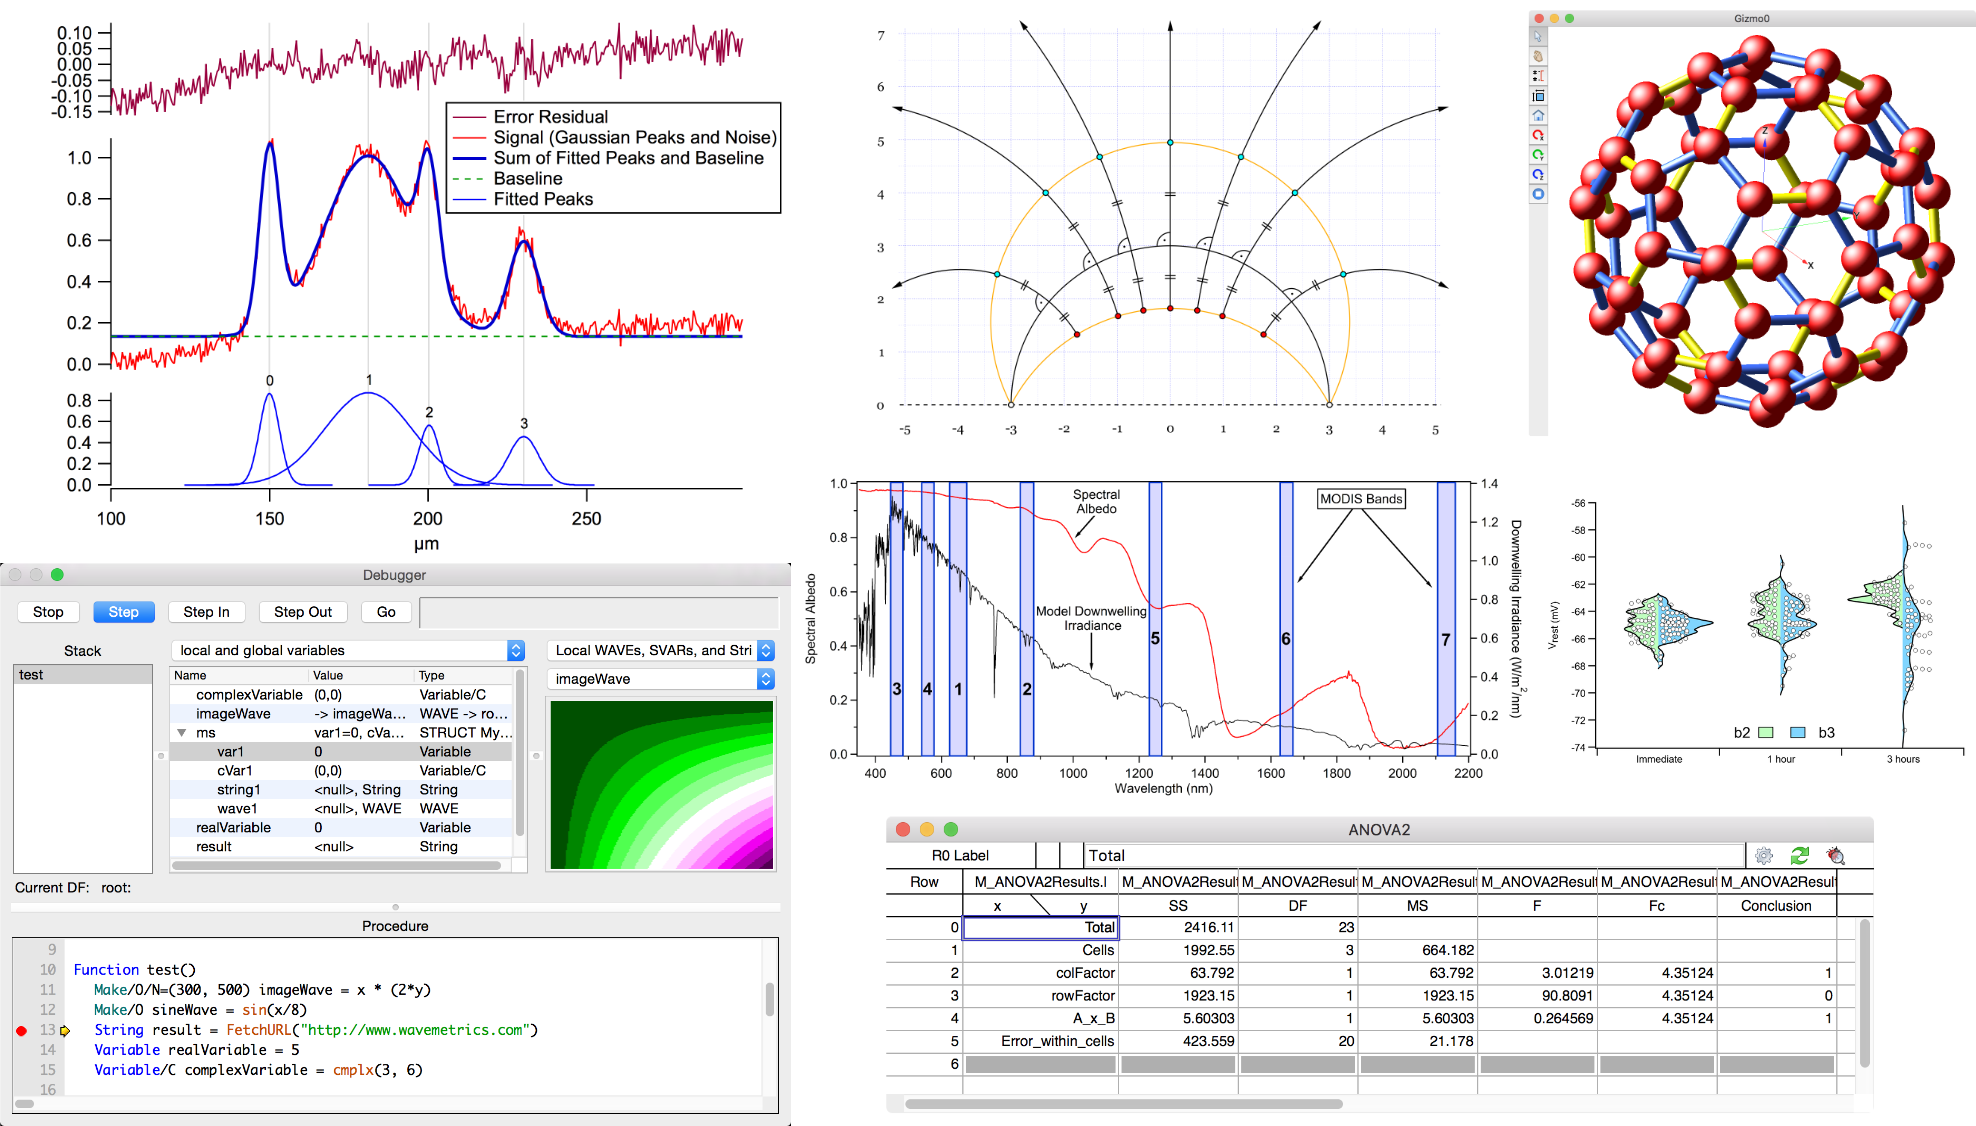
Igor Pro is a fully interactive software environment where you can experiment with your scientific and engineering data AND produce publication-quality graphs and graphics.
| Quickly analyze and graph large data sets | |
| Visualize your data with scientific journal-quality graphs | |
| Take advantage of a wide range of scientific and engineering analysis and graphing capabilities | |
| Comprehensive statistics and curve fitting for data analysis | |
| Includes a powerful suite of image processing operations for image filtering, manipulation, and quantification. | |
| Import data in many formats or acquire data from hardware devices | |
| Cross-platform compatible |
User Programmable
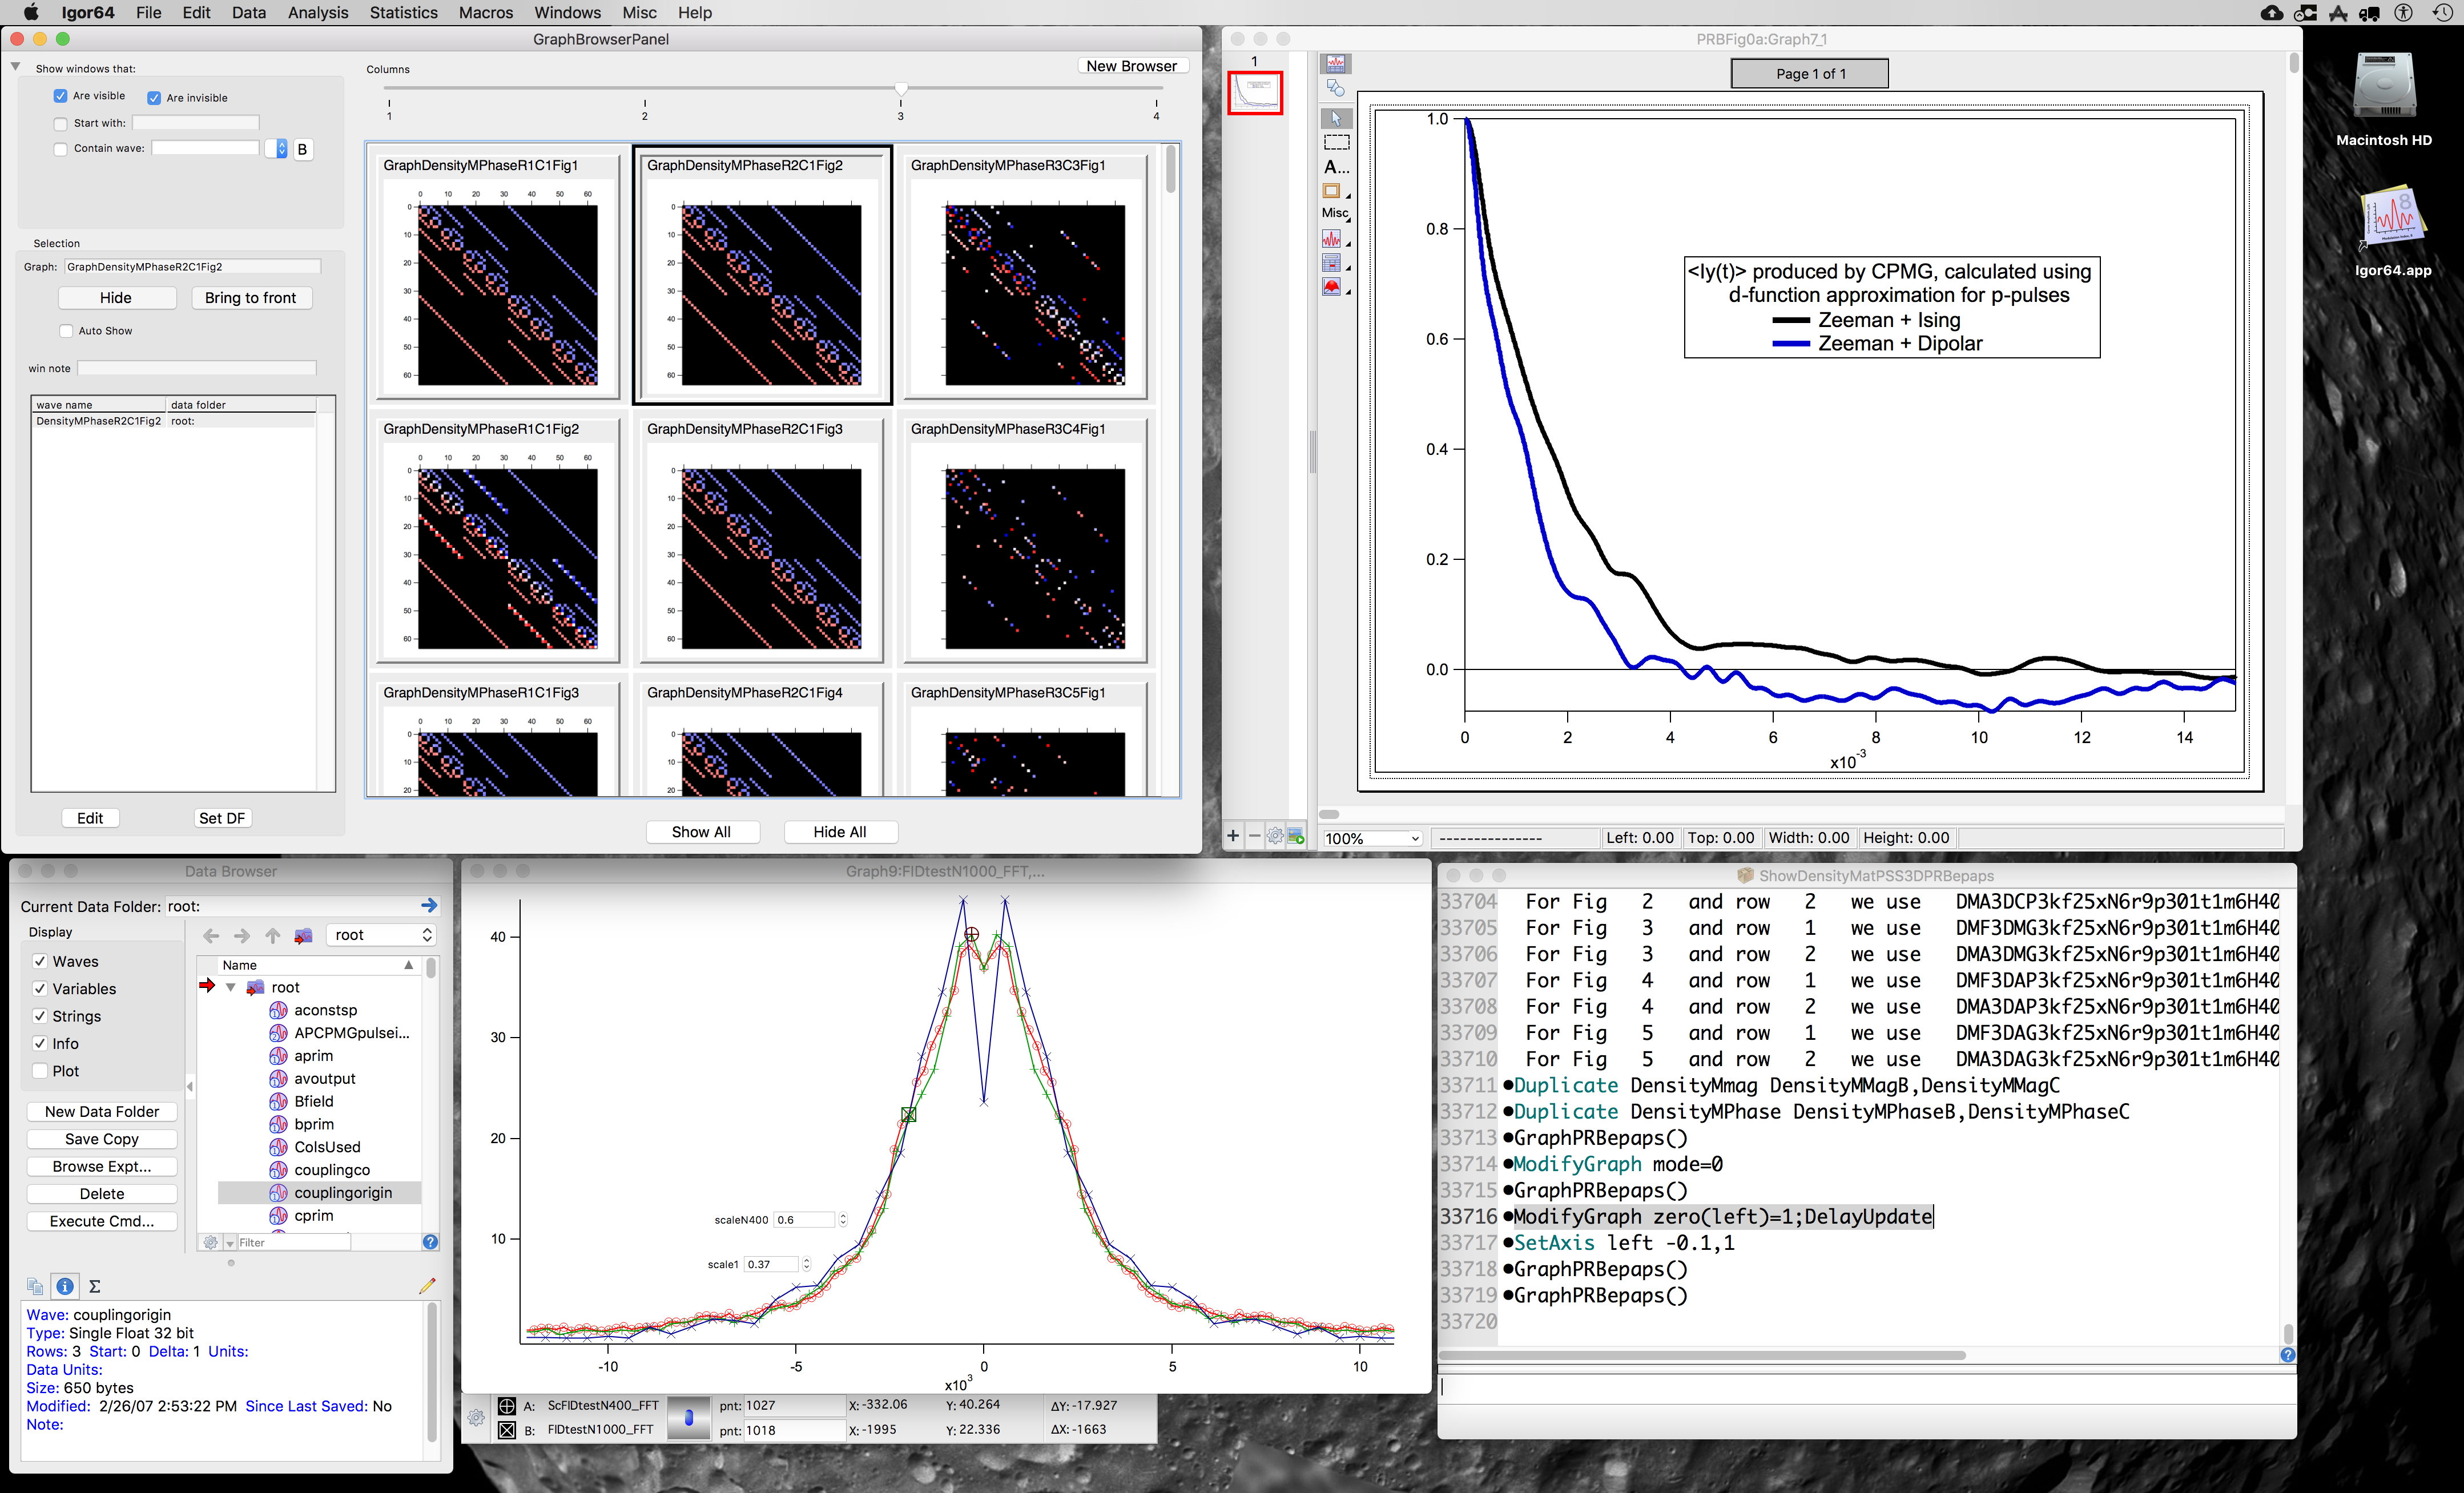
Point-and-click is just the beginning. Add your custom programming using Igor's powerful built-in language to automate your data analysis in new and exciting ways.
| Automate data import, file i/o, analysis, graphs, image, and 3D plots | |
| Troubleshoot Igor Pro code with the symbolic debugger tool | |
| Hundreds of pre-programmed analysis and control commands for rapid algorithm development | |
| Create custom GUIs with controls that perform analyses and display results |
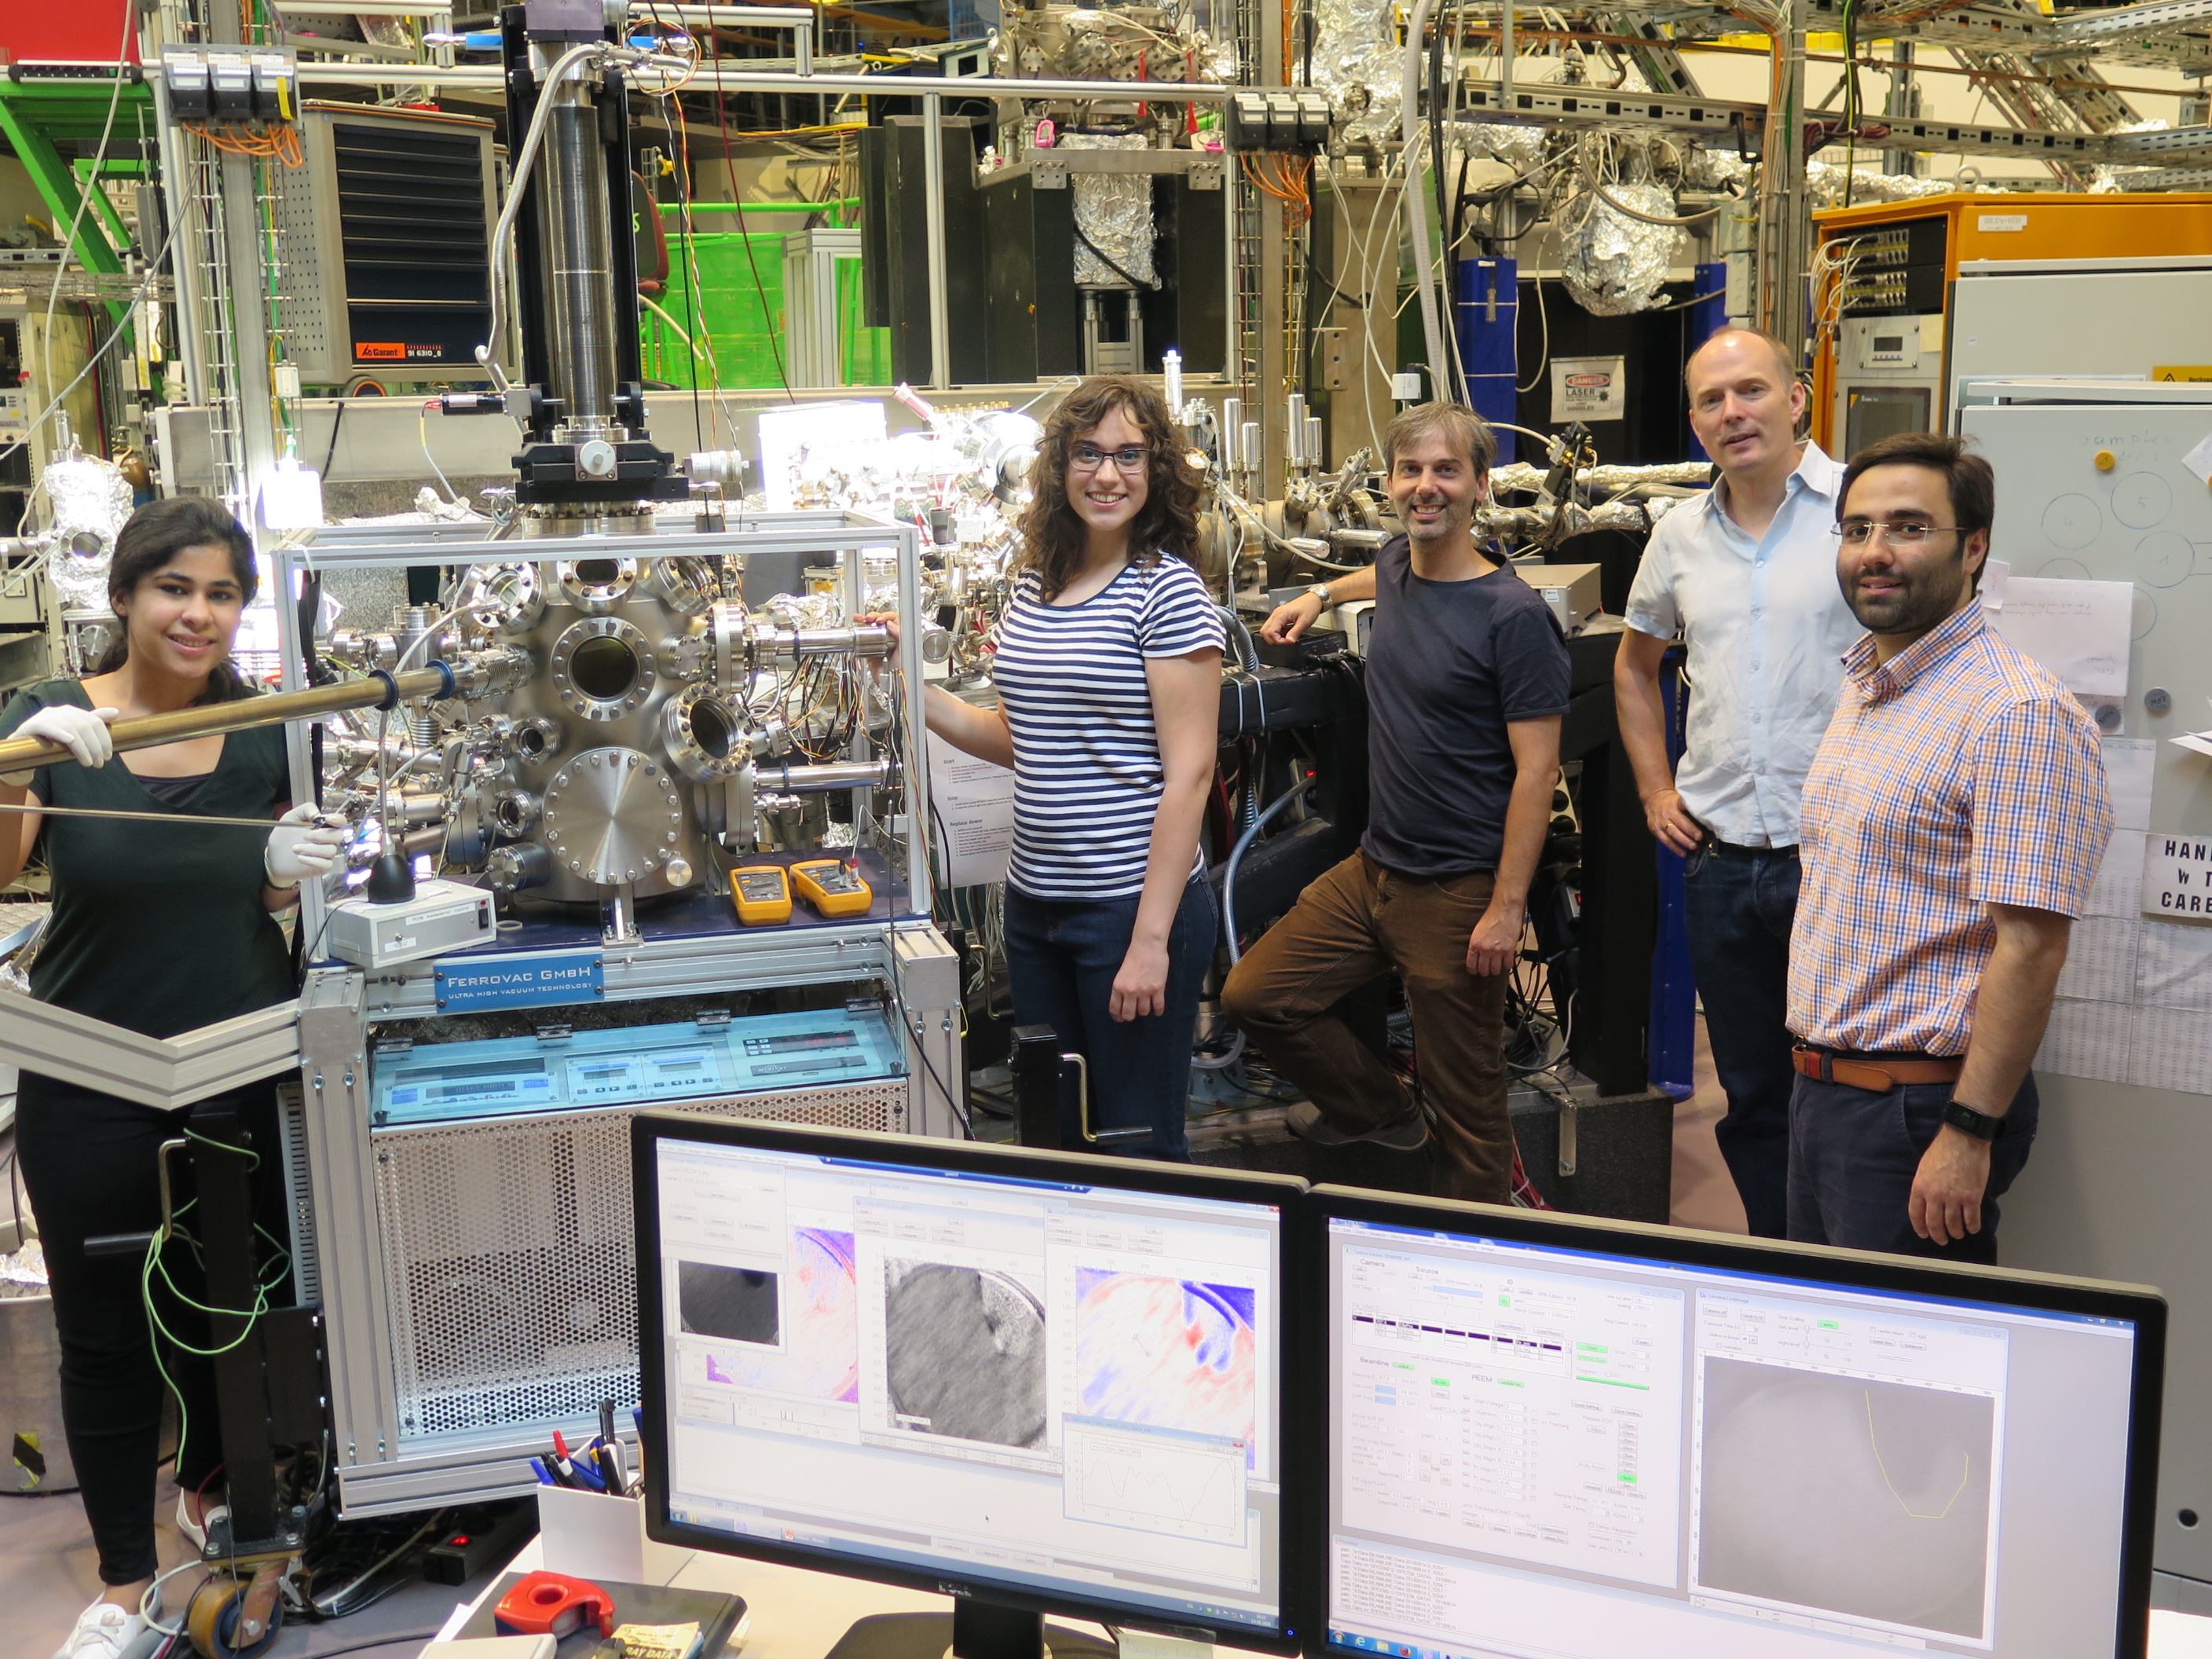
PHOTOS CREDIT
Pictured at right and above: Dr. Florian Kronast and fellow scientists with the BESSYII synchrotron at Helmholtz-Zentrum Berlin. Dr. Kronast has written Igor software to control every aspect of the X-ray photoemission electron microscope, and added "on-the-fly" data analysis as well. (Click the image for a larger view.)


