3D scatter graphs are frequently used when the data are not arranged on a rectangular grid. Simple 3D scatter graphs display an object or marker corresponding to each datum. More complicated scatter graph include datum specific marker attributes, drop-lines and combinations of the scatter data with additional objects such as a fitted surface.
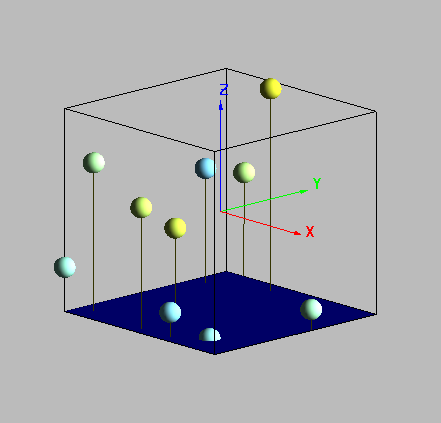
Scatter plots can be drawn with drop-lines (lines from the datum to some key location such as the origin or a particular plane).
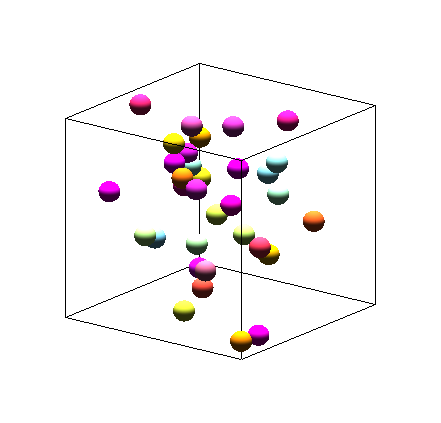
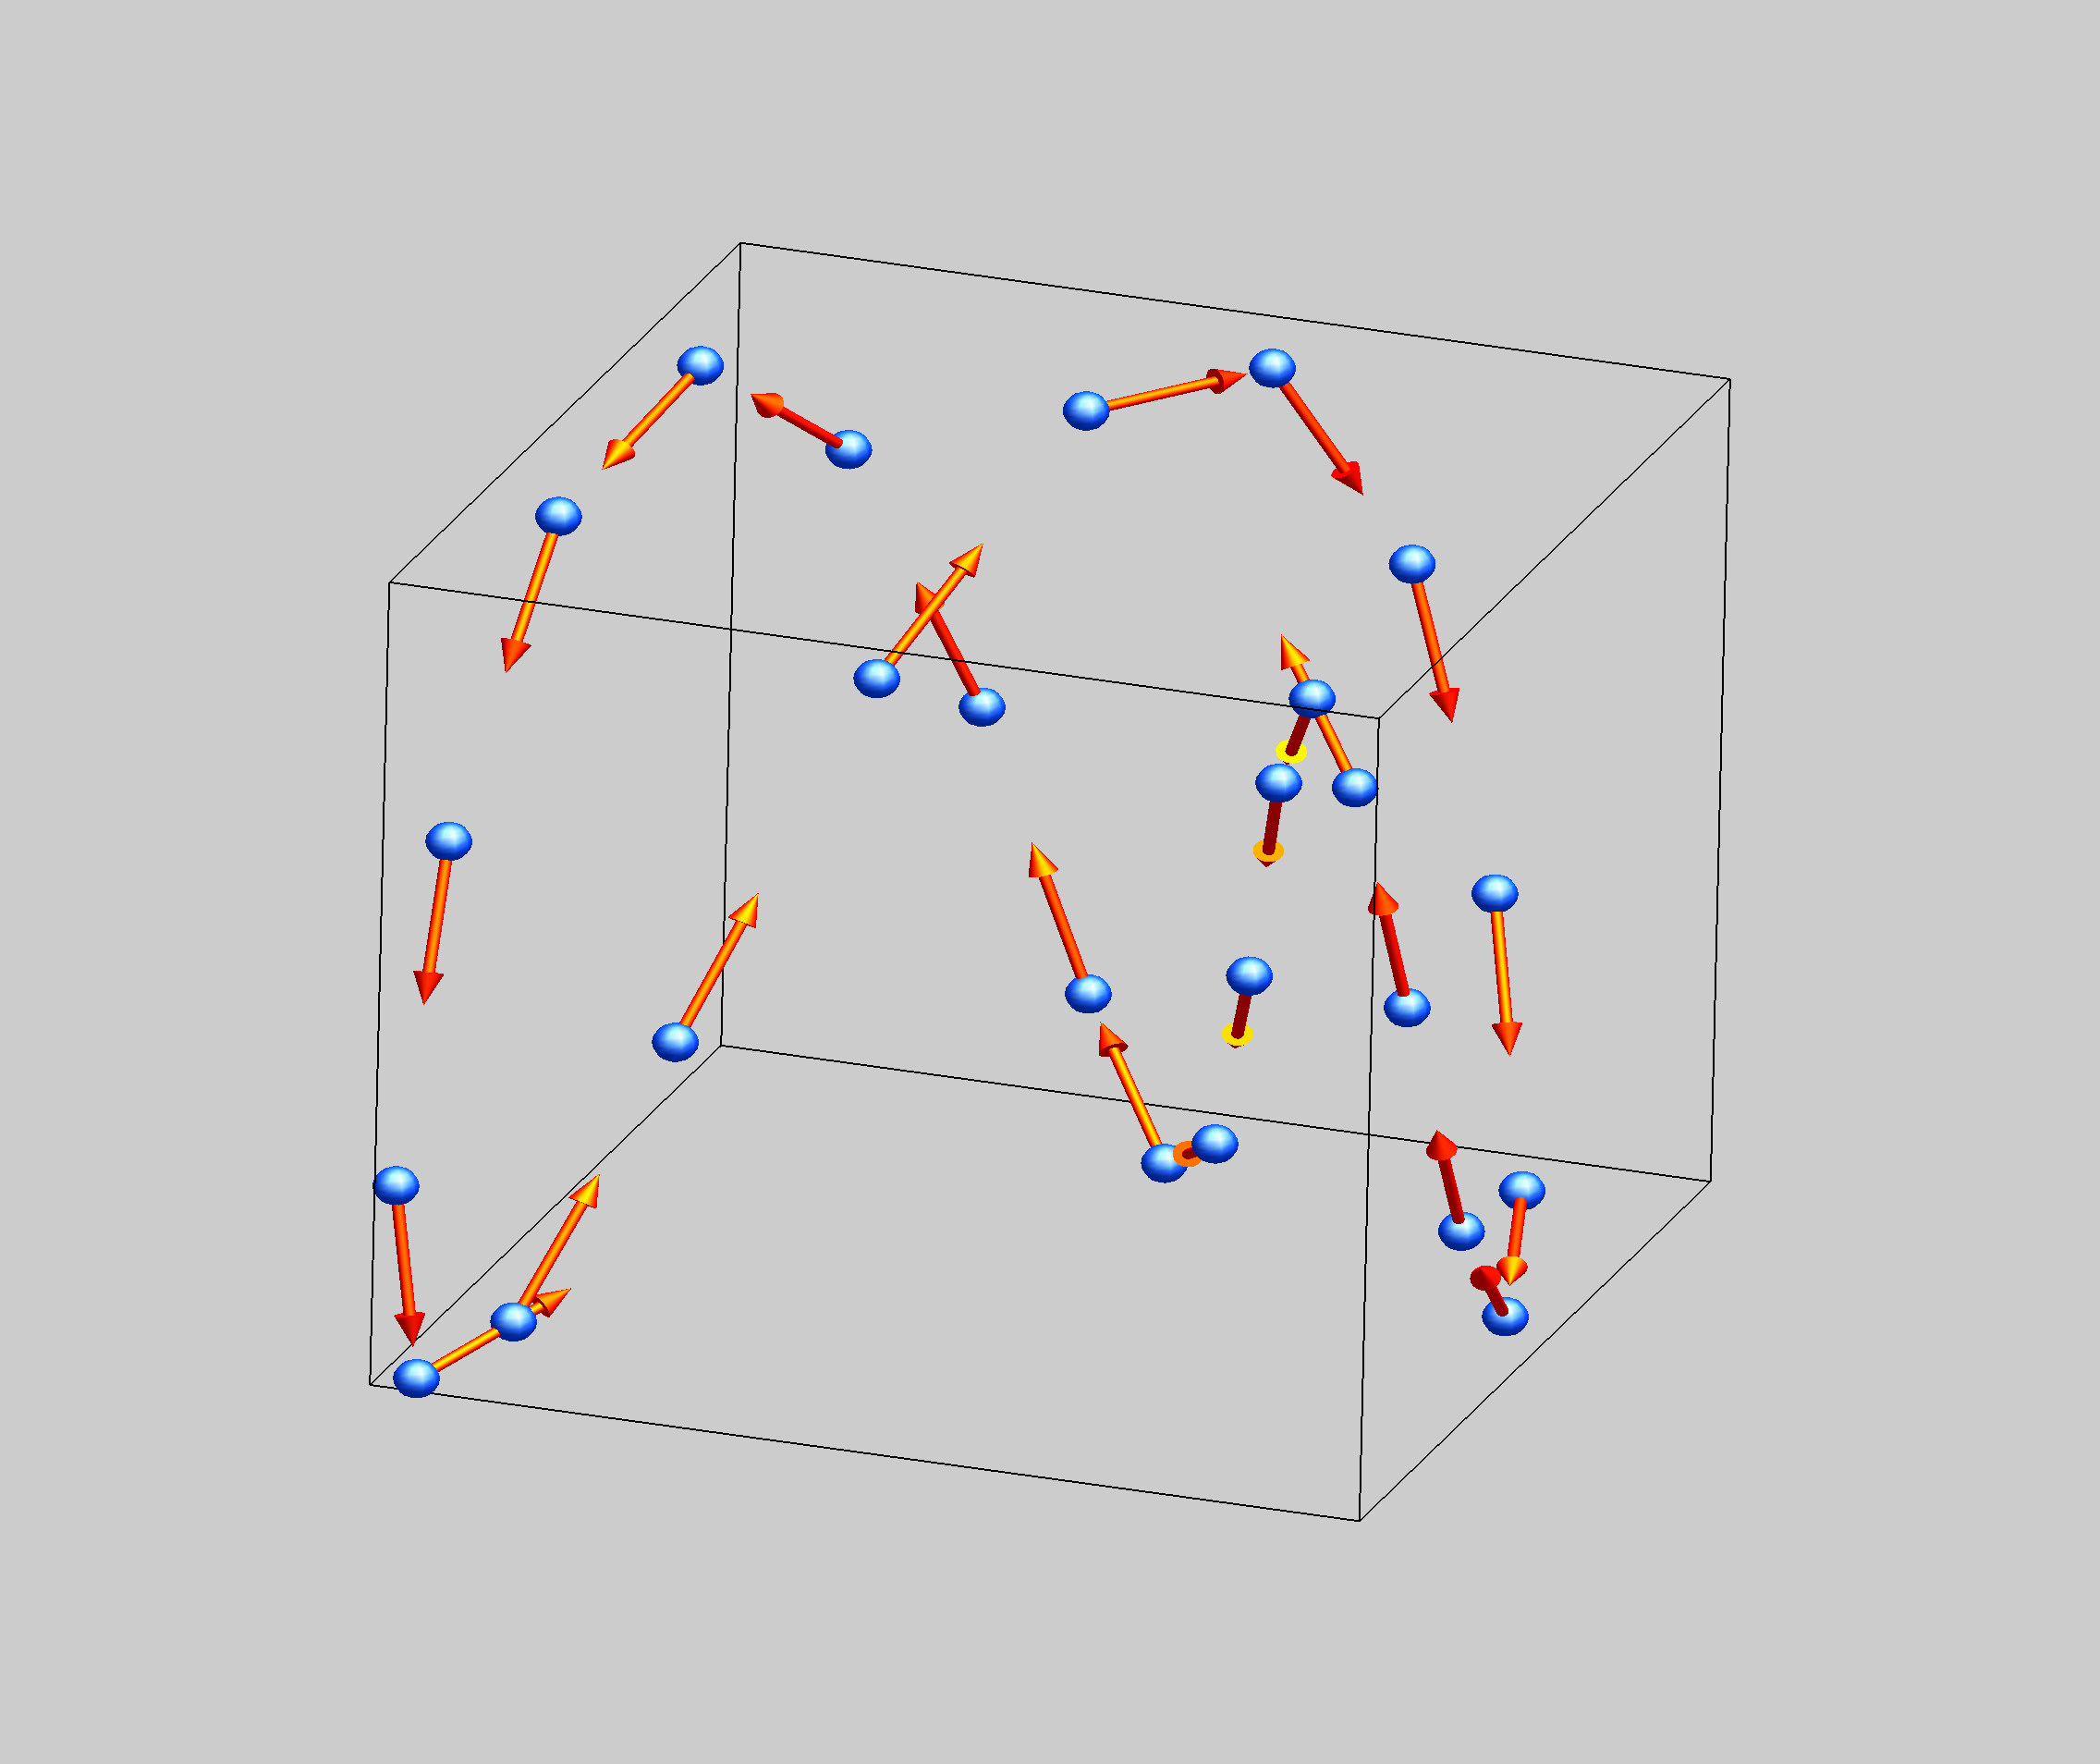
You can associated additional information with each datum using color as in the example above, but you can also use object size or object orientation.
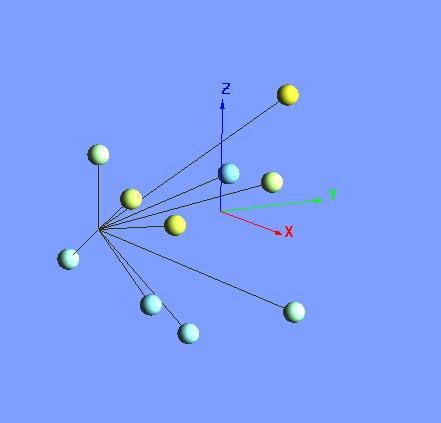
Here is an example of a scatter plot where we display local orientation of a Lissajous figure using 3D arrows as the scatter object.
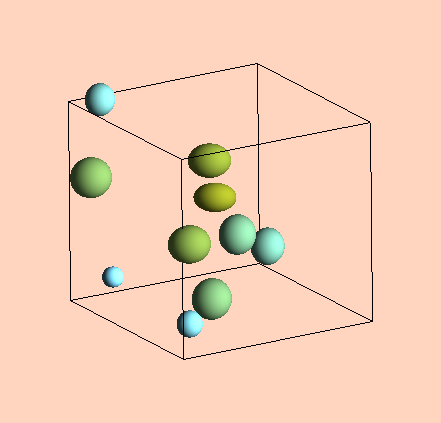
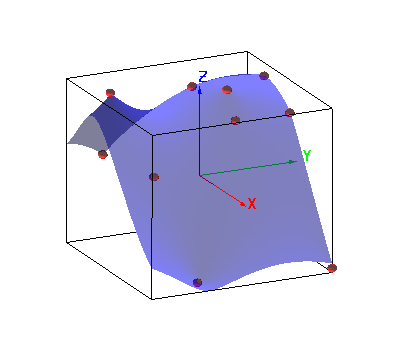
Another common application of scatter plots is to display both measured experimental data and the theoretical fit. The example below shows some random data with a transluscent kriging surface fit.

Forum

Support

Gallery
Igor Pro 10
Learn More
Igor XOP Toolkit
Learn More
Igor NIDAQ Tools MX
Learn More