You can test rank correlation of two waves using the operation StatsRankCorrelationTest. In the first example we consider the two random waves shown in the figure below
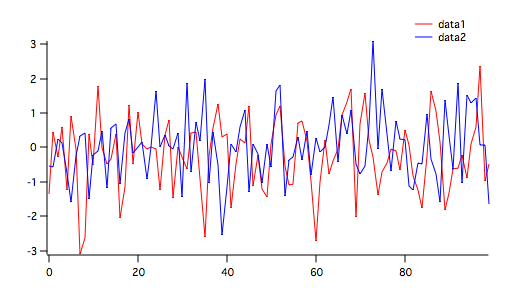
To run the test execute the command:
StatsRankCorrelationTest/T=1/Q data1,data2
The results are displayed in the Rank-Correlation Test table:
| n | 100 |
| sumDi2 | 165316 |
| sumTx | 0 |
| sumTy | 0 |
| SpearmanR | 0.0080048 |
| Critical | 0.196777 |
The Spearman rank correlation coefficient (SpearmanR) is smaller than the critical value so we accept H0, i.e., that there is no correlation between the two waves.
By comparison, you can run the parametric test using the command:
StatsLinearCorrelationTest/T=1/Q data1,data2
results in:
| n | 100 |
| r | -0.0377559 |
| sr | 0.100943 |
| rc1 | 0.16543 |
| rc2 | 0.196551 |
| t_Value | -0.374031 |
| tc1 | 1.66055 |
| tc2 | 1.98447 |
| F | 1.07847 |
| Fc1 | 1.39644 |
| Fc2 | 1.48927 |
| Power1 | 0.0218772 |
| Power2 | 0.00981472 |
Since F < Fc2 we accept H0 corresponding to no rank-correlation between data1 and data2.
The next example shows correlated waves:
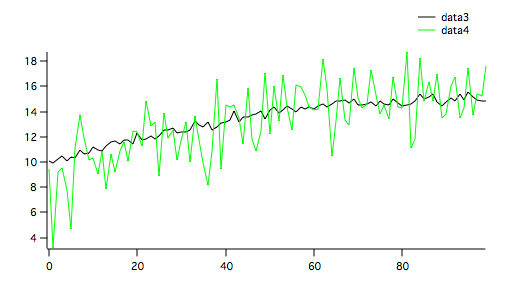
StatsRankCorrelationTest/T=1/Q data3,data4
The results are displayed in the Rank-Correlation Test table:
| n | 100 |
| sumDi2 | 49716 |
| sumTx | 0 |
| sumTy | 0 |
| SpearmanR | 0.701674 |
| Critical | 0.196777 |
With SpearmanR > Critical value we clearly reject H0 and conclude that data3 and data4 are rank-correlated. If we now compare with the parametric test:
StatsLinearCorrelationTest/T=1/Q data3,data4
The results of the parametric test are:
| n | 100 |
| r | 0.728588 |
| sr | 0.0691906 |
| rc1 | 0.16543 |
| rc2 | 0.196551 |
| t_Value | 10.5302 |
| tc1 | 1.66055 |
| tc2 | 1.98447 |
| F | 6.36887 |
| Fc1 | 1.39644 |
| Fc2 | 1.48927 |
| Power1 | 1 |
| Power2 | 1 |
In this case F > Fc2 and we again reject H0 (no correlation) and conclude that the two waves are correlated.

Forum

Support

Gallery
Igor Pro 10
Learn More
Igor XOP Toolkit
Learn More
Igor NIDAQ Tools MX
Learn More