Isosurfaces plots are surfaces that represent a constant scalar value in a 3D scalar distribution. They are an extension to 2D contour plots. Isosurfaces are computationally intensive so unless you need to obtain a very high resolution plot, you might benefit from the more efficient voxelgram.
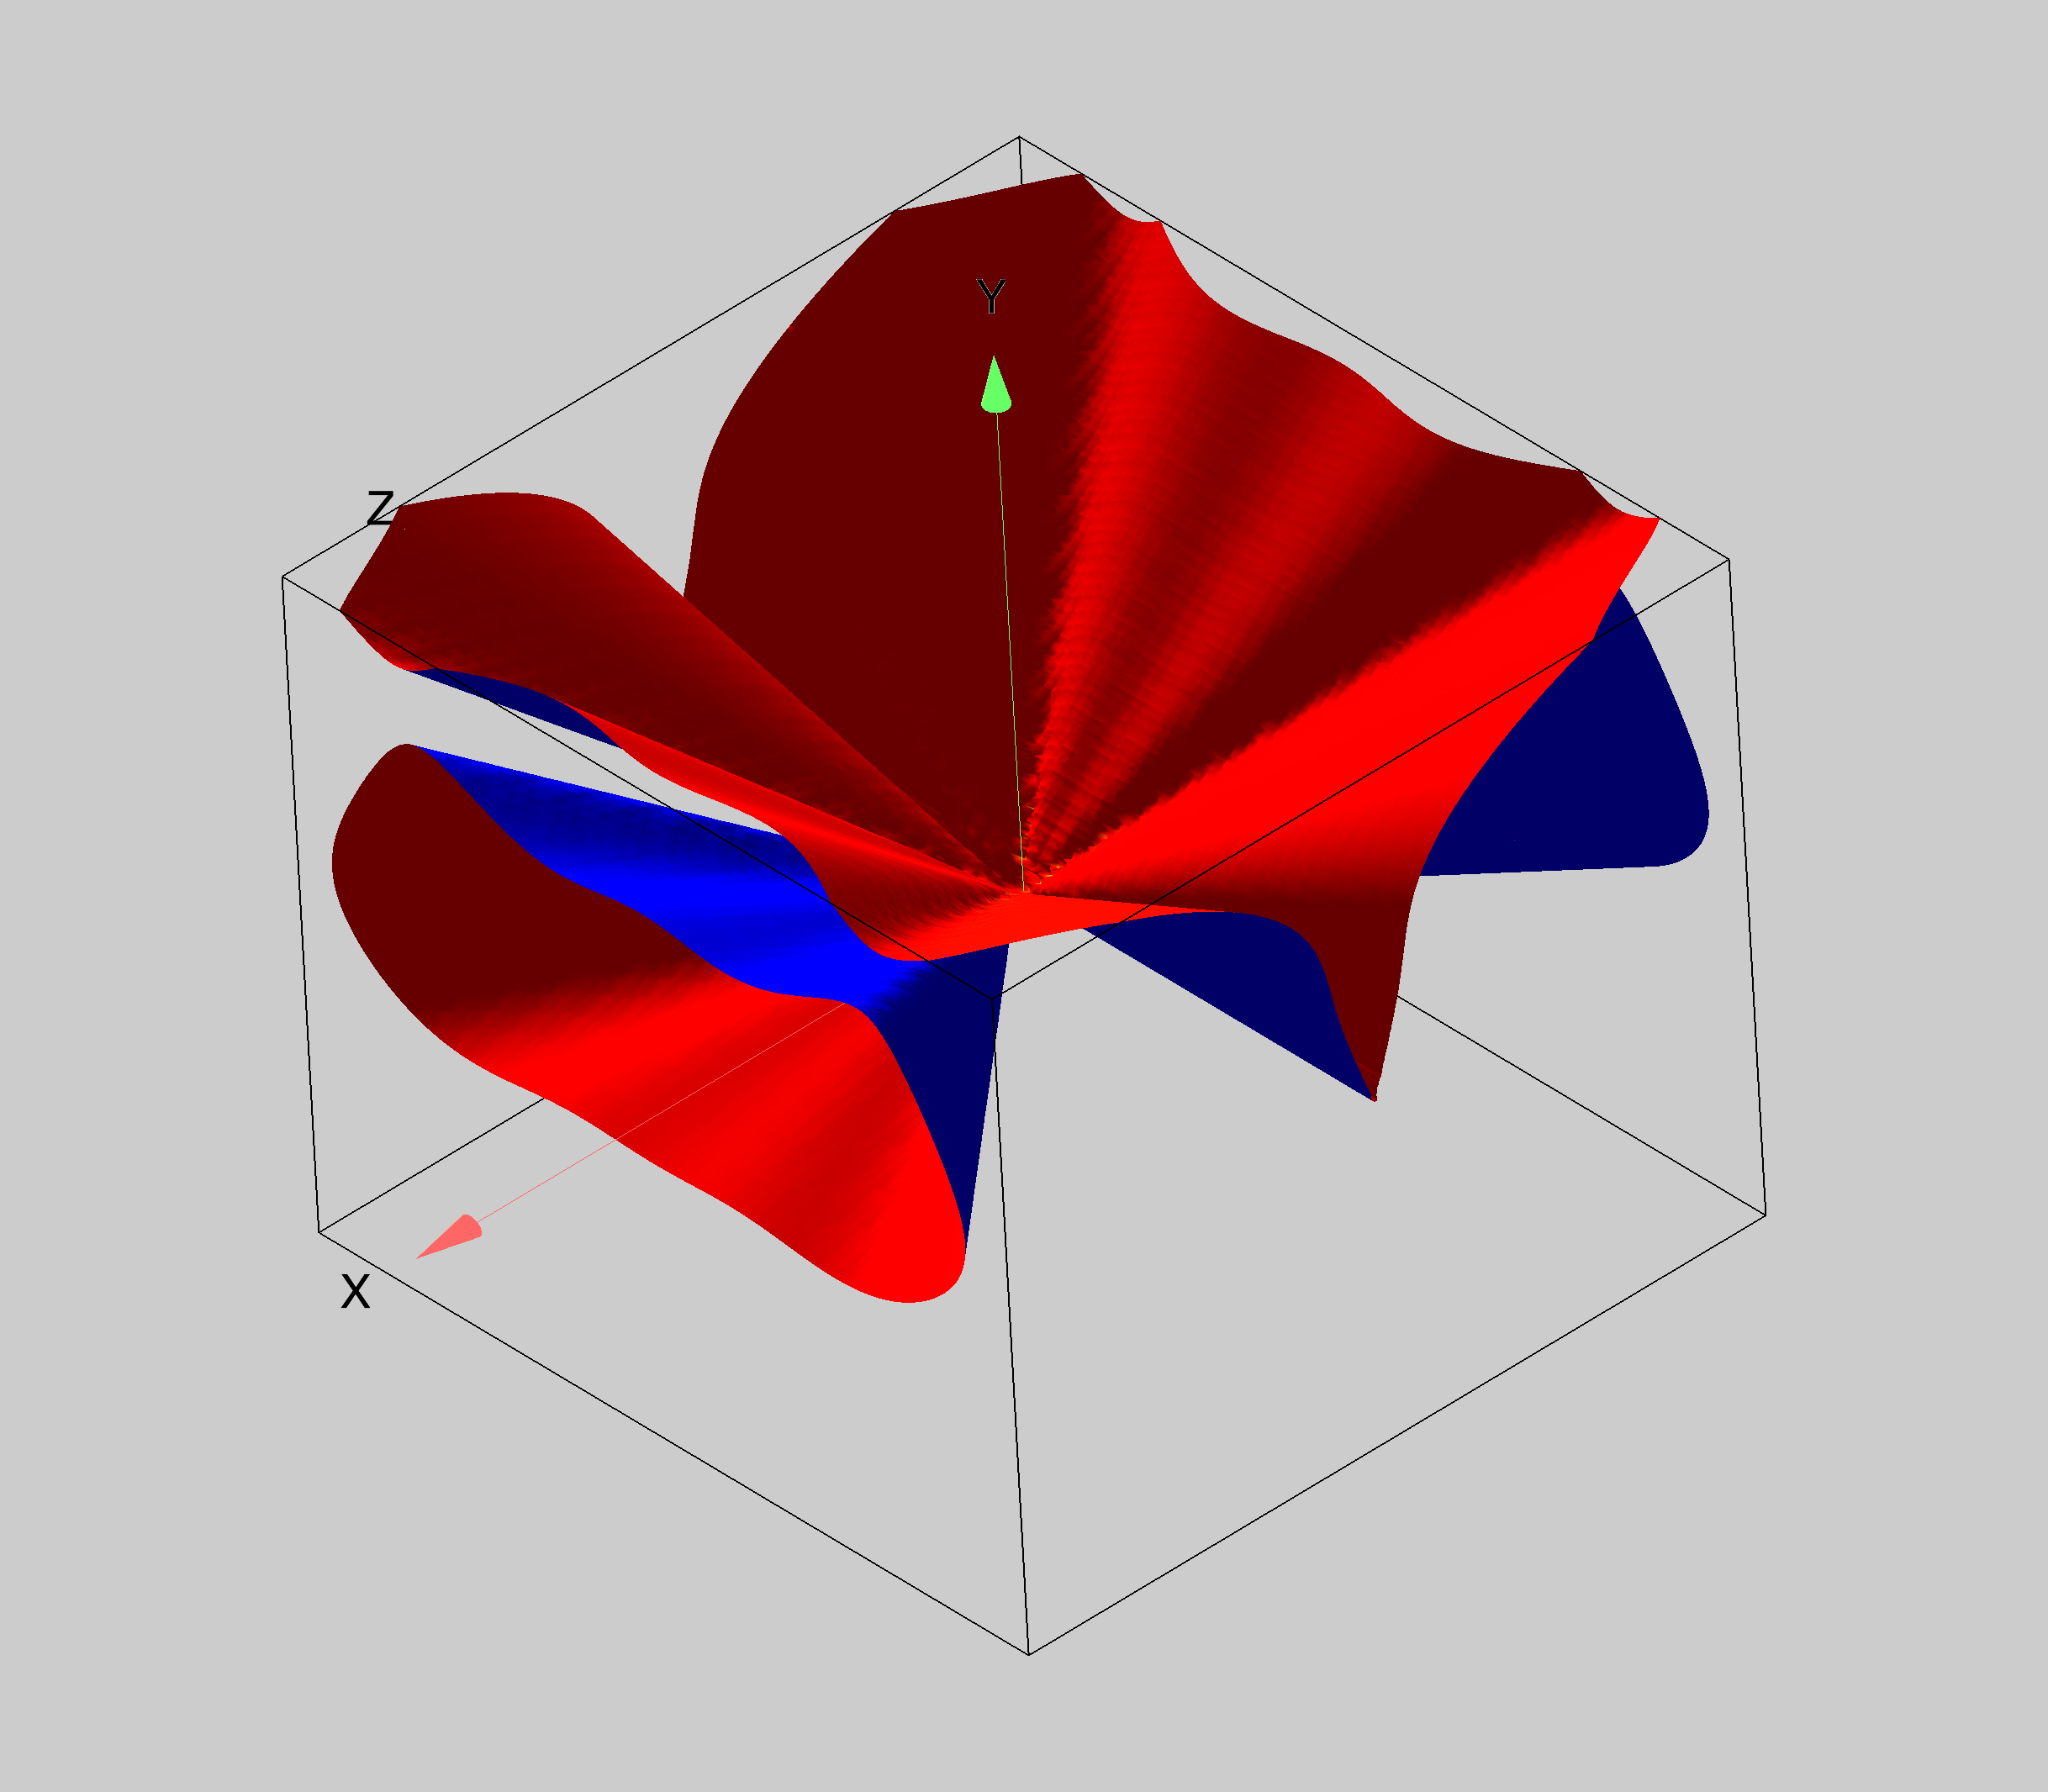
Consider the equation
v=sin(phi)+cos(2*phi)^2+sin(3*theta)^2+cos(2*theta)^5.
The following graph shows an isosurface of created from a 100x100x100 wave for v=3.
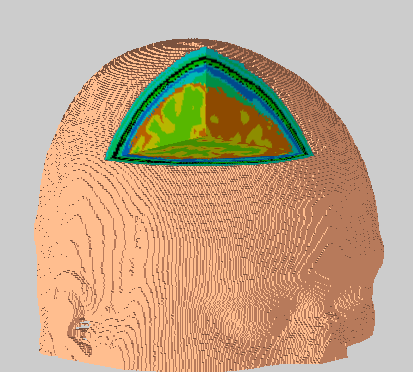
A more interesting combination of isosurfaces and parametric surfaces is the processed MRI image. In this case the exterior of the skull was created by the ImageTransform operation (keyword vol2surf) and the three orthogonal slices are false color parametric surfaces.

Forum

Support

Gallery
Igor Pro 10
Learn More
Igor XOP Toolkit
Learn More
Igor NIDAQ Tools MX
Learn More