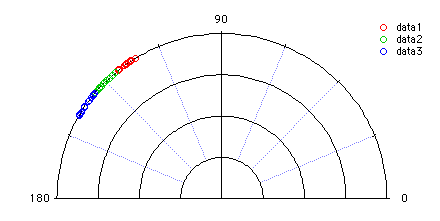
In this example we have three groups of data contained in the numeric waves data1, data2 and data3. The values represent angles in radians:
| data1 | data2 | data3 |
| 2.173 | 2.34269 | 2.55387 |
| 2.15495 | 2.42743 | 2.52051 |
| 2.24984 | 2.35977 | 2.60009 |
| 2.16018 | 2.32347 | 2.60166 |
| 2.12517 | 2.34709 | 2.57084 |
| 2.17603 | 2.37079 | 2.47116 |
| 2.19694 | 2.27066 | 2.58406 |
| 2.17019 | 2.39049 | 2.4725 |
| 2.20484 | 2.36472 | 2.54683 |
| 2.24169 | 2.43949 | 2.46343 |
| 2.18406 | 2.26981 | 2.47491 |
| 2.24535 | 2.40376 | 2.53199 |
| 2.19074 | 2.40725 | 2.51363 |
| 2.18796 | 2.42927 | 2.54139 |
| 2.1496 | 2.29848 | 2.59919 |
The data are shown here in a polar plot:
Multi-sample testing for angular dispersion
The three input waves were created using uniformly distributed random numbers centered on 125, 135 and 145 degrees respectively. We therefore expect the angular distance test to indicate low dispersion. To run the test execute the command:StatsAngularDistanceTest/T=1/Q/ANGM data1,data2,data3
The results of the test are shown in the "Kruskal-Wallis Test" table:
| Num_Groups | 3 |
| Num_Valid_Data | 45 |
| Alpha | 0.05 |
| H | 3.83614 |
| Hc_Chi_square_approx | 5.99146 |
| P_Chi_square_approx | 0.146891 |
| Hc_Wallace_approx | 6.04367 |
| P_Wallace_approx | 0.15194 |
The H statistic is clearly below both the Chi-square and Wallace approximate critical values so the hypothesis H0: no effective dispersion can't be rejected at the default 0.05 significance level. Note that in this case we have used the /ANGM flag to compute the relative dispersion of the data about each sample's mean instead of providing sample means using the /ANGW flag. Here the operation first computes the mean of each sample and then performs the Kruskal-Wallis test on the difference of each datum from its corresponding mean value.
Two-sample testing for angular dispersion
Here we run a different test on the first two waves that we tested above. The operation computes the mean direction of the two samples and then performs the nonparametric Wilcoxon test on the differences between each datum and the mean direction. To run the test just execute the command:StatsAngularDistanceTest/T=1/Q/ANGM data1,data2
The results of the test are shown in the "Mann-Whitney Wilcoxon Test" table:
| m | 15 |
| n | 15 |
| TotalPoints | 30 |
| U_statistic | 74 |
| Up_statistic | 151 |
| P_Value | 0.946777 |
As one would expect, we get a P-value which is much greater than alpha (0.05) so H0: no dispersion can't be rejected.
Two-sample testing for angular dispersion with user-specified mean direction
In this example we test the same samples (which were generated as data centered at 125 and 135 degrees respectively) relative to mean direction of 135 degrees for both. To run the test execute the command: StatsAngularDistanceTest/T=1/Q/ANG={2.35619,2.35619} data1,data2The results of the test are shown in the "Mann-Whitney Wilcoxon Test" table:
| m | 15 |
| n | 15 |
| totalPoints | 30 |
| U_statistic | 225 |
| Up_statistic | 0 |
| P_Value | 6.38465e-09 |
Clearly, the P-value is less than alpha and so we reject H0.

Forum

Support

Gallery
Igor Pro 10
Learn More
Igor XOP Toolkit
Learn More
Igor NIDAQ Tools MX
Learn More