The Igor Pro® full-featured symbolic debugger gives you a powerful tool to get your code working properly by observing its state while execution is paused.
The debugger window will automatically appear when one of the following events occurs:
- An error occurs, and you have enabled Debug on Error.
- An error dialog is presented, and you click the Debug button.
- A breakpoint that you previously set is encountered.
- The
Debuggeroperation is encountered.
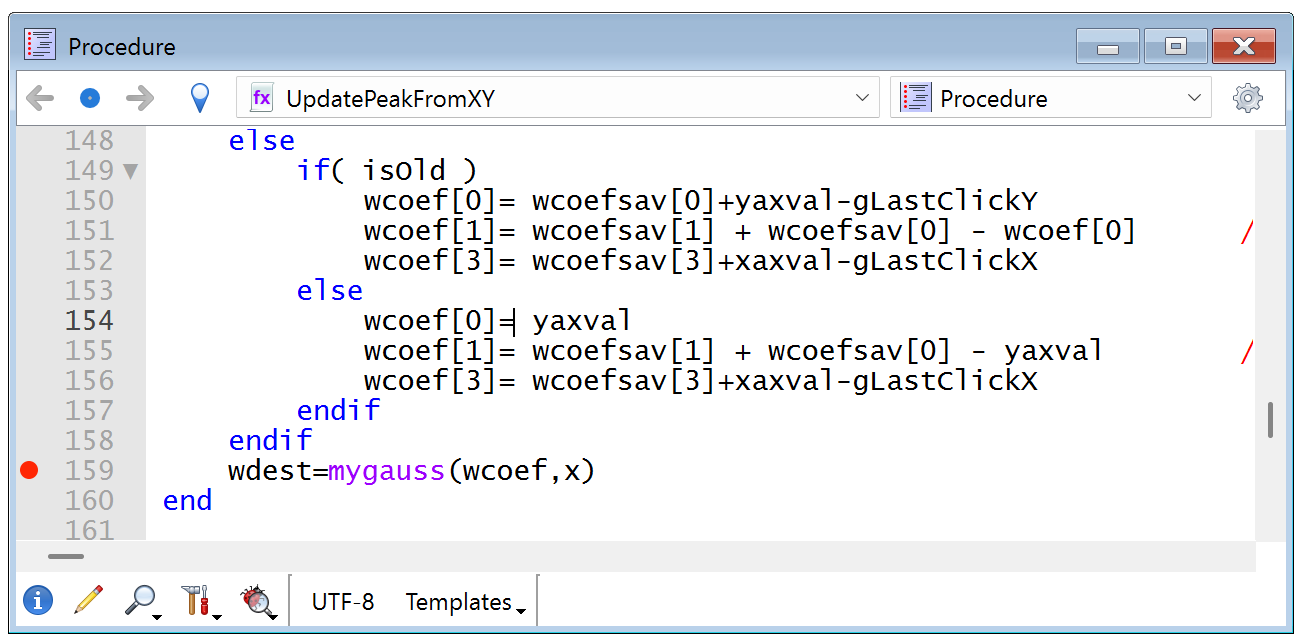
You set breakpoints simply by clicking in the procedure window´s left margin:
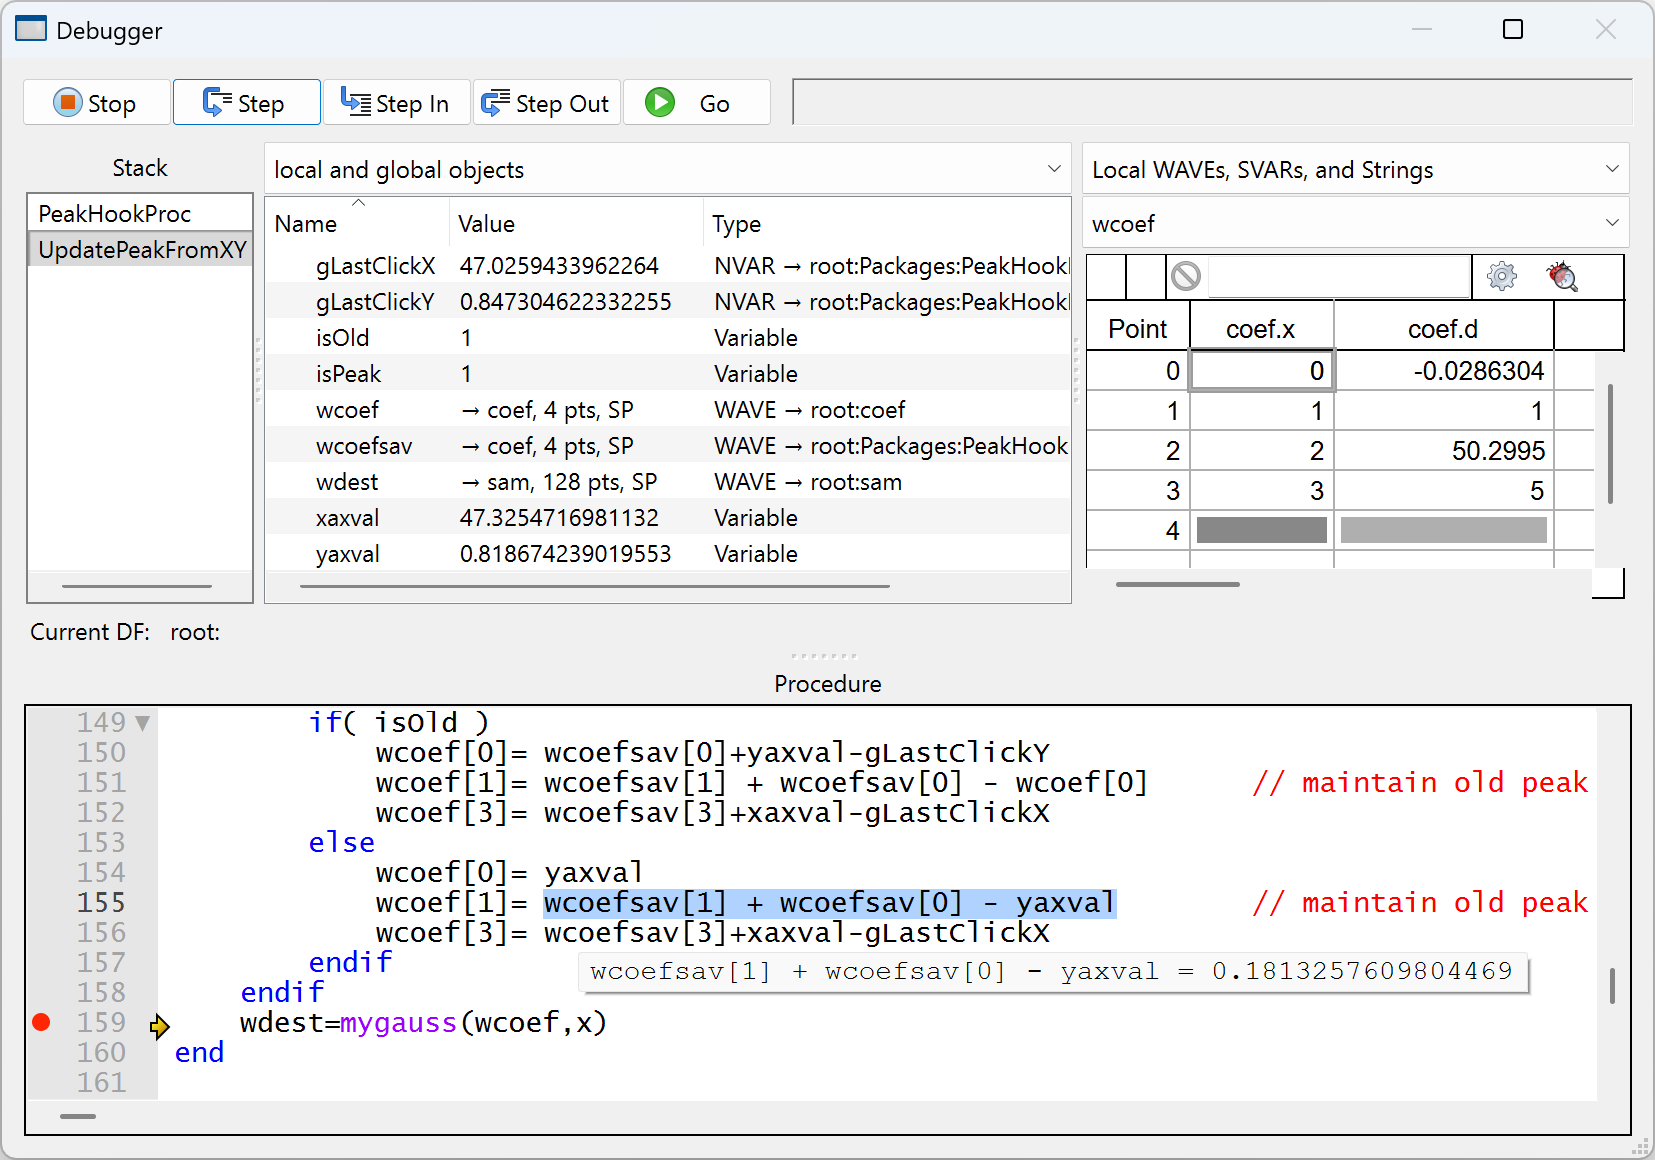
Once in the debugger, you can execute a single line of code by pressing the "Step" button, step into or out of a routine, resume execution by pressing the "Go" button, or stop executing with the"Stop" button.
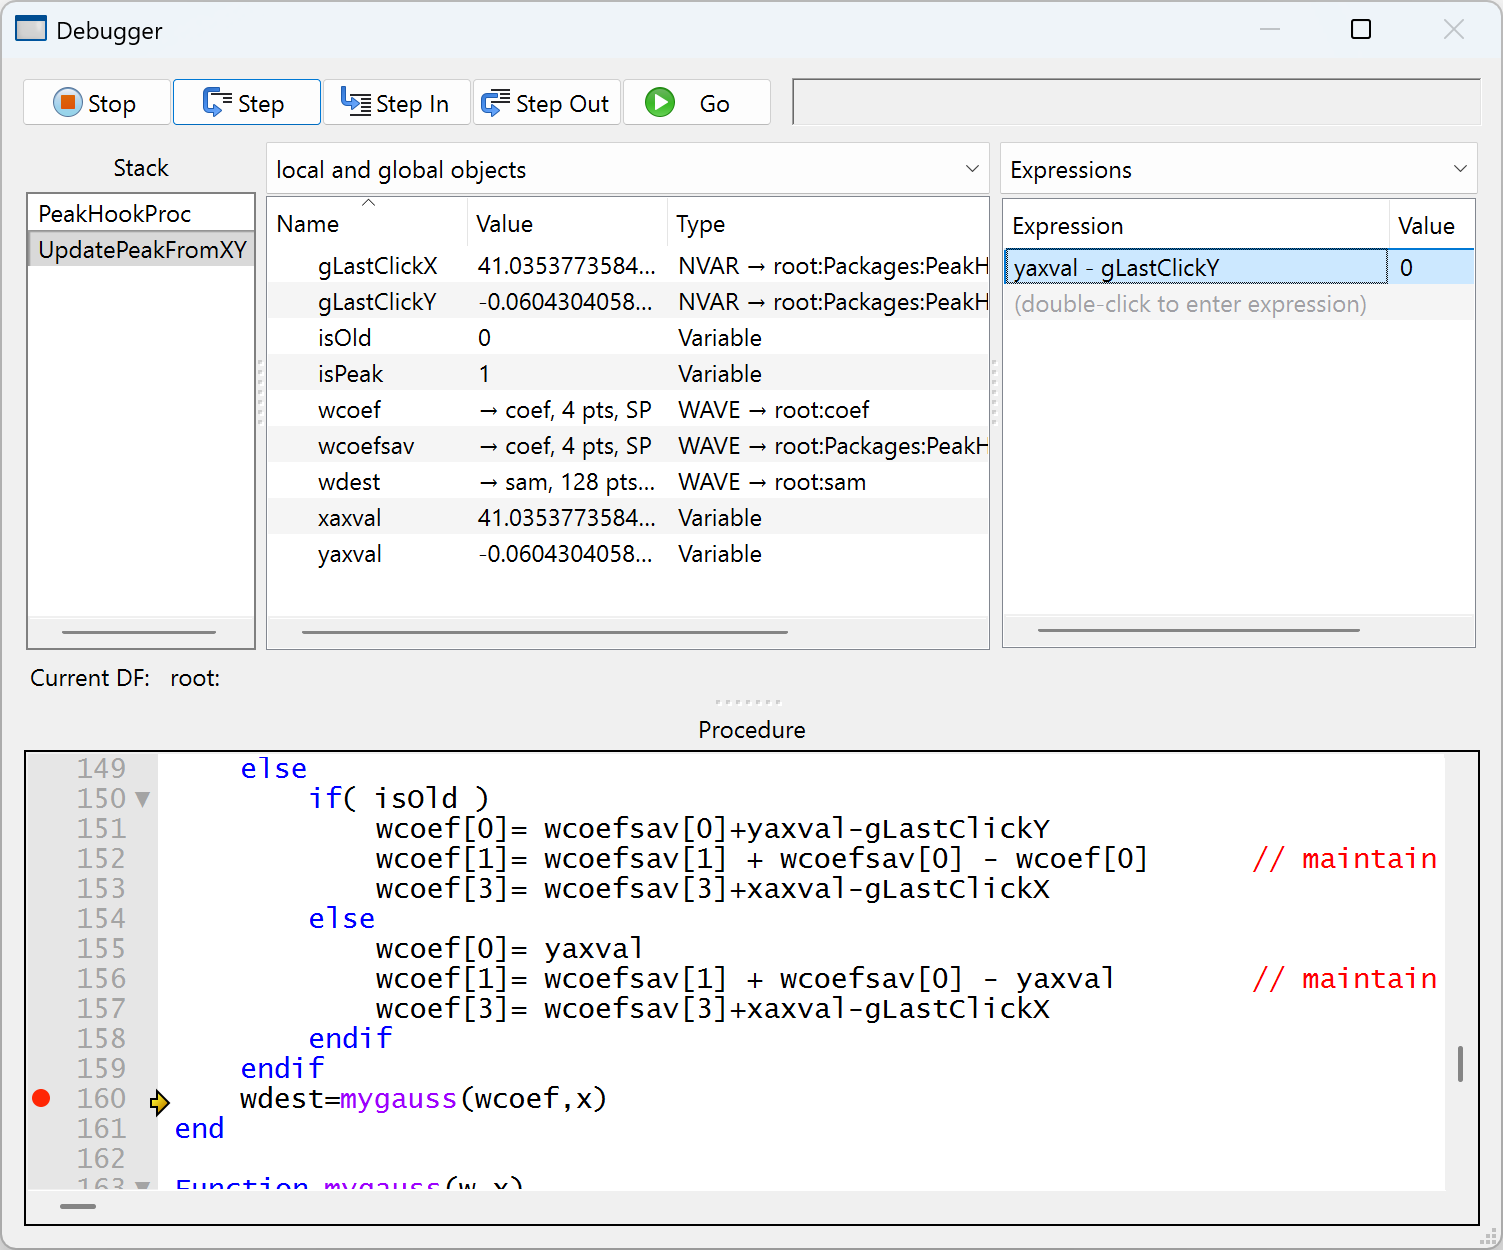
You can view the routine that is currently executing and the chain of routines that called it in the Stack list. The top row shows the routine that began execution and the bottom row shows the routine currently executing. You can examine the variables associated with any routine in the Stack list by simply selecting the routine in the Stack list:
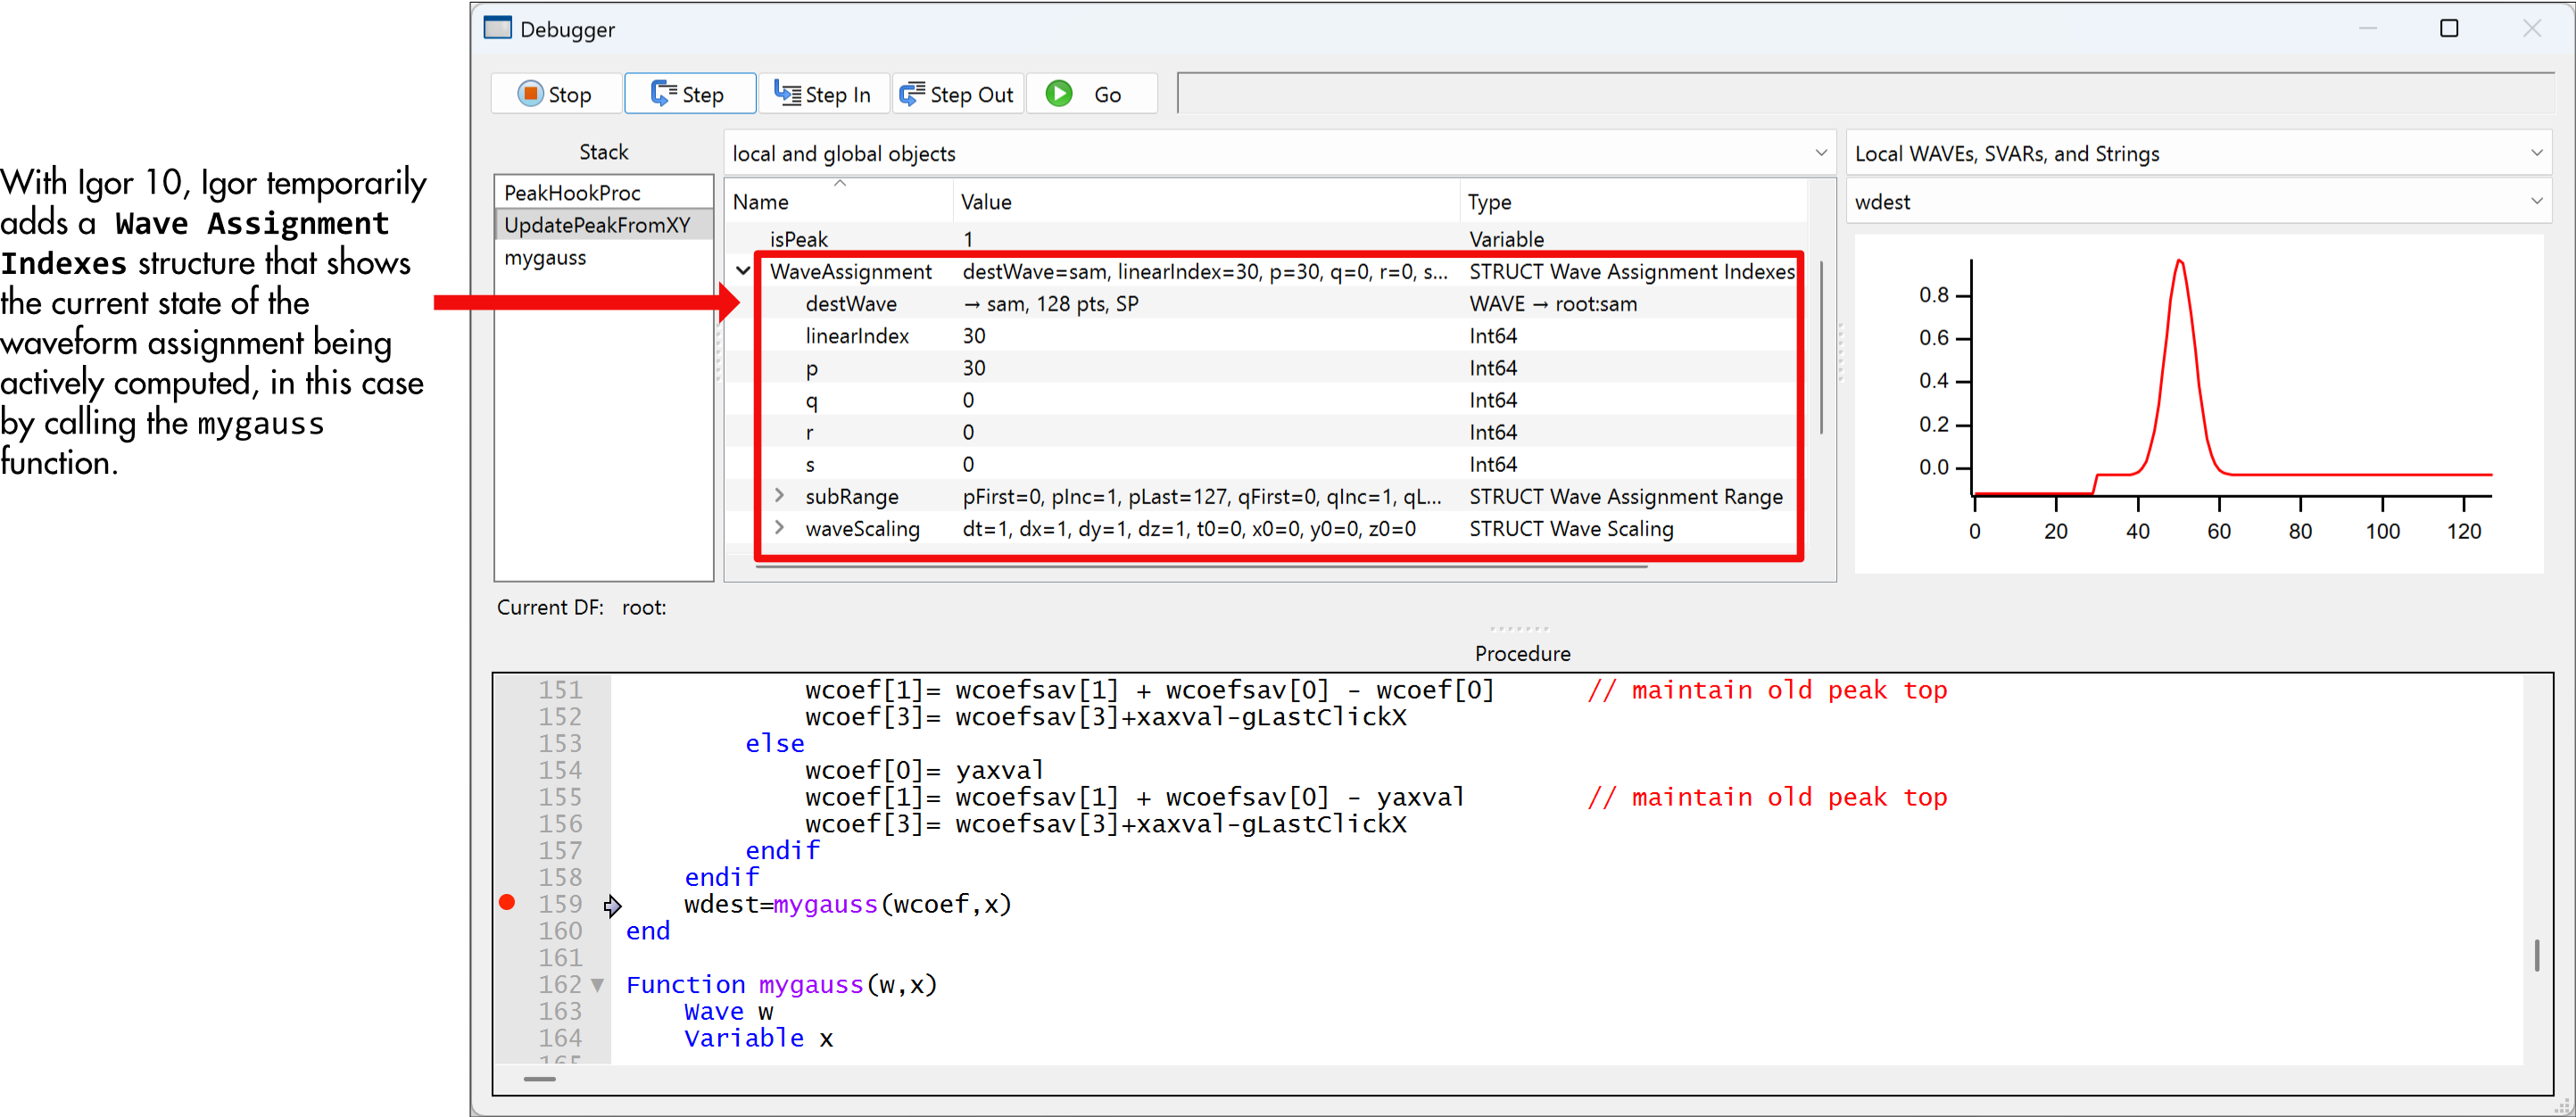
The current state of the Wave Assignment shows that point 30 of wdest is being computed, and shows that the wave scaling (dx) is the default value.
You can also see that the wdest wave's first 30 points have already been computed, and from the subRange values you can see that all 128 points will be computed (points 0 to 127).
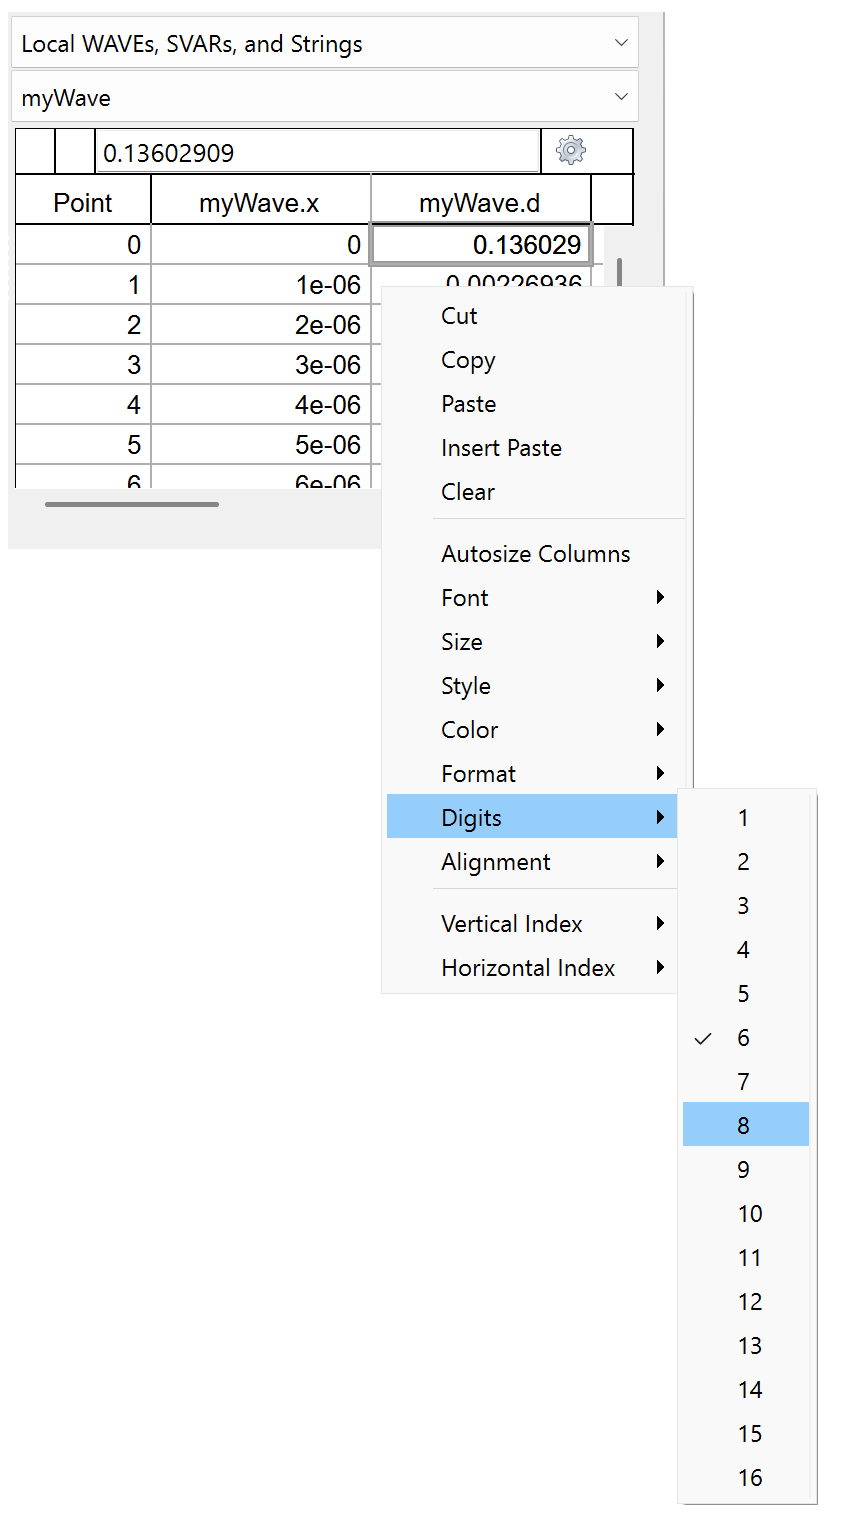
You can view the values of all user-defined and built-in objects along with the object type. And you can edit values by double-clicking their current value.
Wave values can be examined as a list in a table or as a trace or image in graph:
You can enter expressions that use local or global variables. The expression´s value is evaluated at every step of the program.
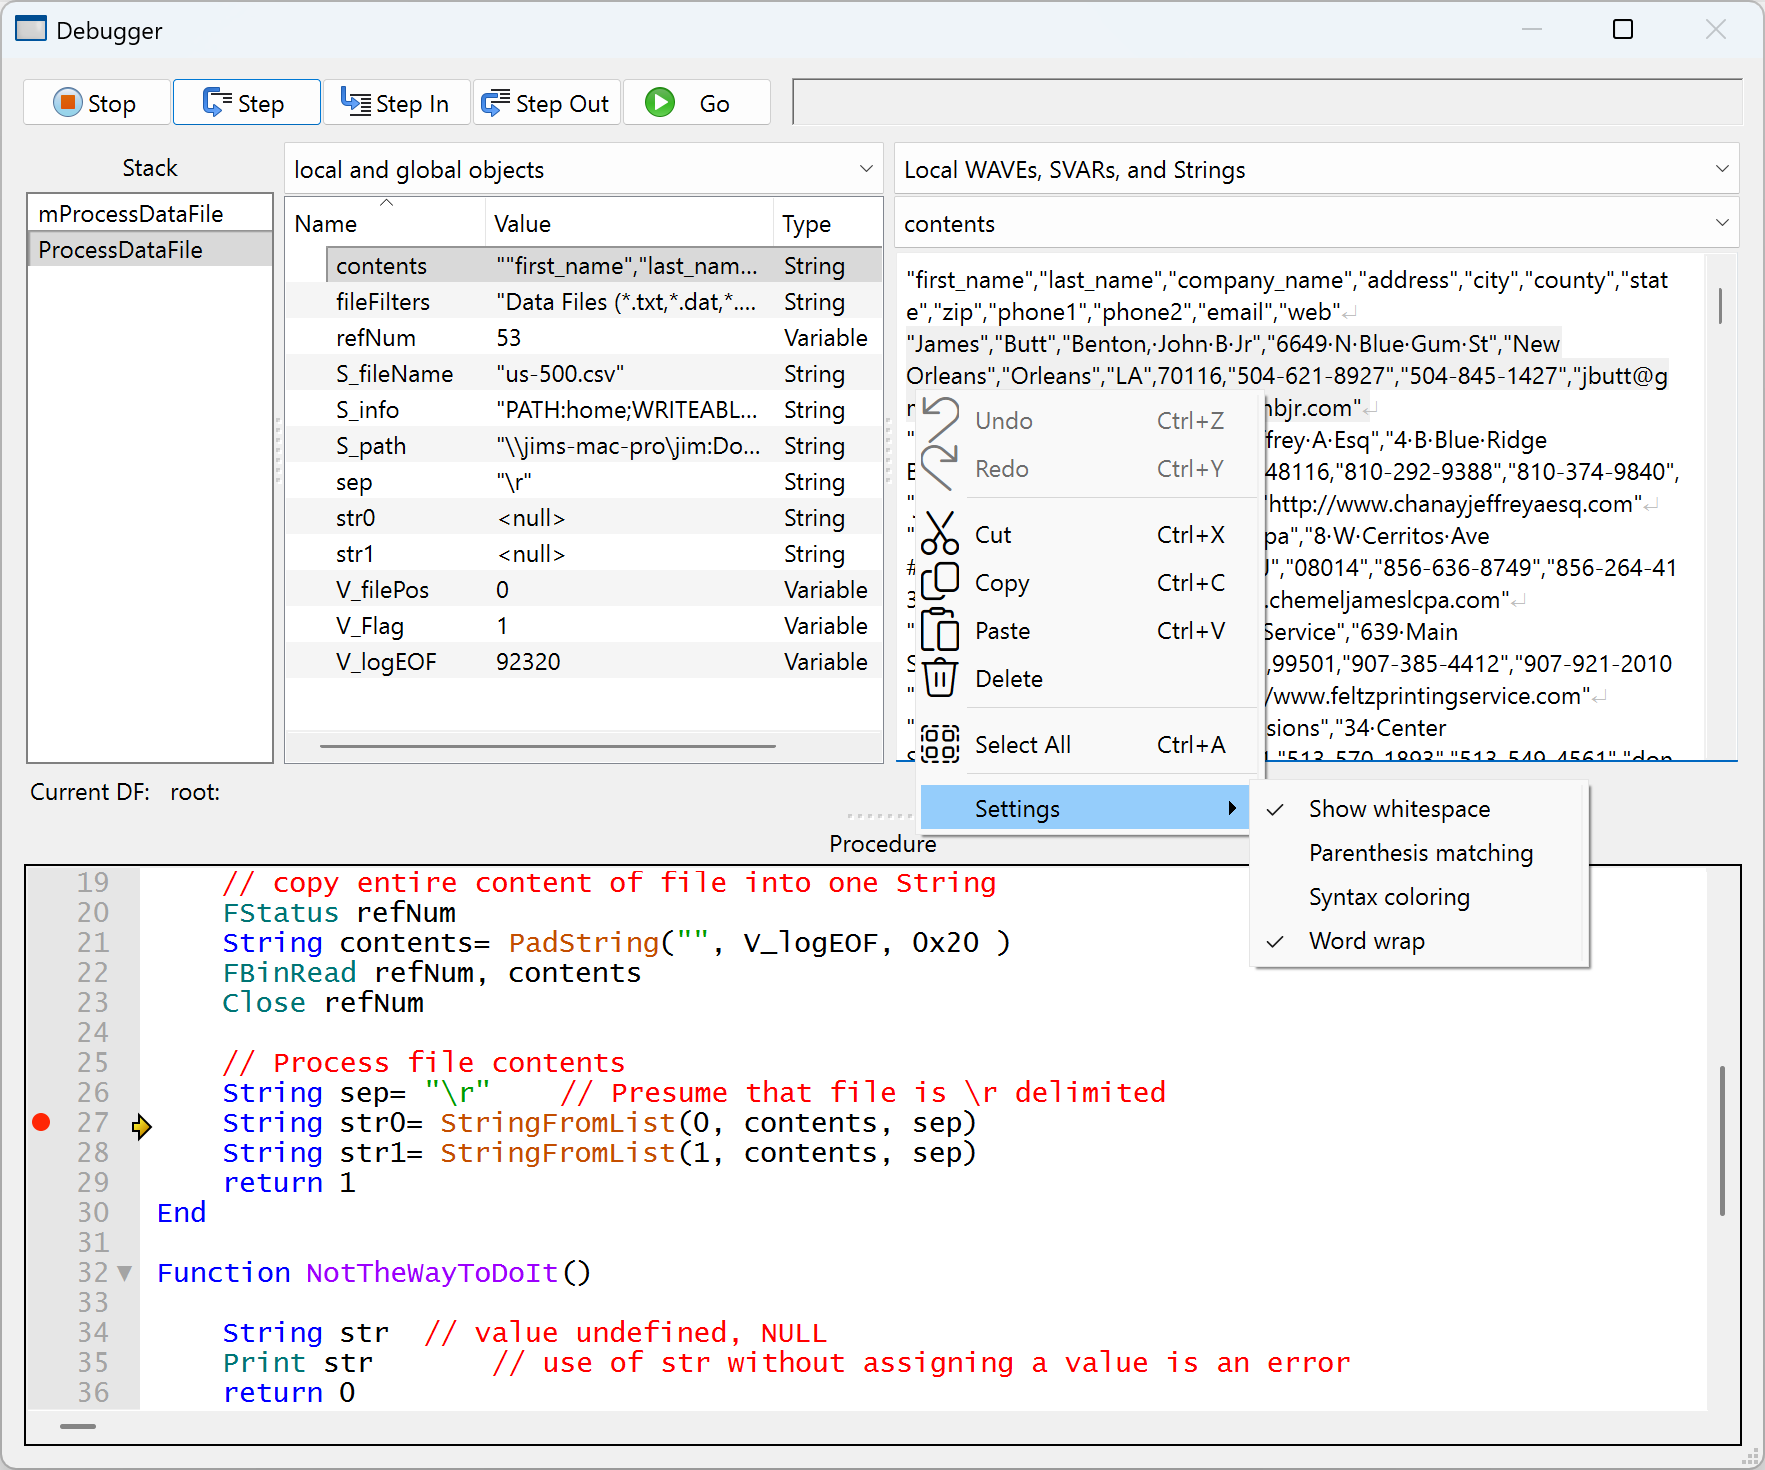
Igor Pro has a "string inspector" that is useful for viewing and editing very long strings. It is especially useful when the string contains multiple lines of text such as the entire content of a multi-line data file:

Forum

Support

Gallery
Igor Pro 10
Learn More
Igor XOP Toolkit
Learn More
Igor NIDAQ Tools MX
Learn More