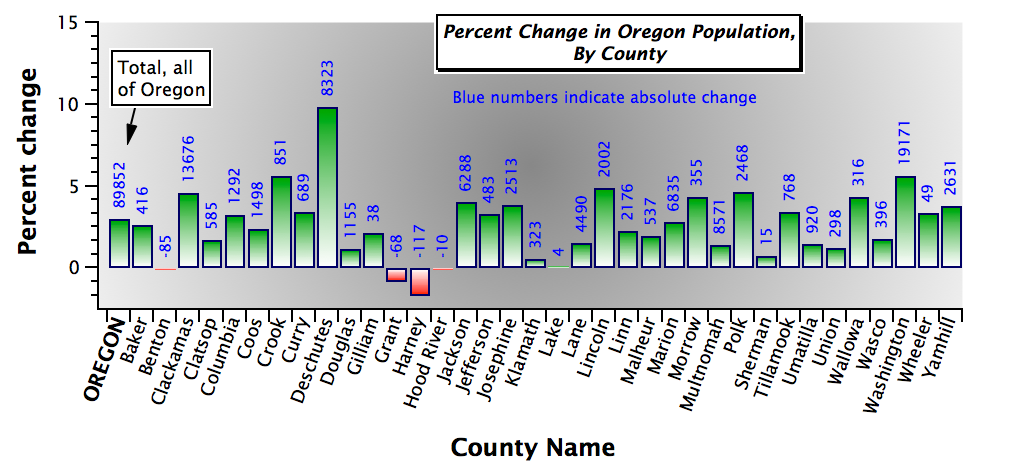
Category plots are two-dimensional plots with a continuous numeric variable on one axis and a non-numeric (text) category on the other. Most often they are presented as bar charts with one or more bars occupying a category slot either side-by-side or stacked or some combination of the two.
You can also combine them with error bars:
Category plots are created in ordinary graph windows when you use a text wave as the X data.

Forum

Support

Gallery
Igor Pro 10
Learn More
Igor XOP Toolkit
Learn More
Igor NIDAQ Tools MX
Learn More