The StatsSRTest operation contains both parametric and non-parametric serial randomness tests. In the following examples we illustrate how they work (and how they fail).
1. Testing serial randomenss of gnoise().
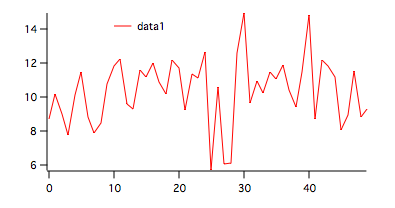
The first data set is created with the command:
Make/O/N=50 data1=10+gnoise(2)
The resulting wave appears in the figure below.
To run both tests on this wave execute the command:
StatsSRTest/T=1/Q/P/NP data1
The results are displayed in the Serial Randomness Test table:
| N | 50 |
| s2 | 3.71269 |
| ss2 | 3.30635 |
| C | 0.109447 |
| Critical | 0.228249 |
| P-Value | 0.217518 |
| Runs Up | 17 |
| Runs Down | 16 |
| Unchanged | 0 |
| Longest Run | 4 |
| Longest Run Prob. | 0.473586 |
| Total Runs | 33 |
| Prob | 0.565534 |
The first six rows in the table belong to the parametric test. In this case we have a statistic C which is smaller than the critical value so the hypothesis H0 that the wave contains a random variation is accepted though the P-value is not particularly high. The remaining rows of the table belong to the non-parametric test. After listing the number of runs up and down, the table includes the longest run and the probability that a run of such length can happen by chance. The last two rows contain the total number of runs and the probability that such a value can be attained by chance.
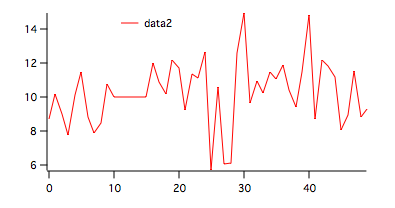
2. Testing serial randomness in the presence of non-random data segment.
We create the second data set by duplicating the first and setting a contiguous run of length N/10 to a constant. The following commands were used:
Duplicate data1,data2
data2[10,14]=10
To run both tests on this wave execute:
StatsSRTest/T=1/Q/P/NP data2
The results are displayed in the Serial Randomness Test table:
| N | 50 |
| s2 | 3.53478 |
| ss2 | 3.18483 |
| C | 0.099004 |
| Critical | 0.228249 |
| P-Value | 0.240177 |
| Runs Up | 16 |
| Runs Down | 15 |
| Unchanged | 1 |
| Longest Run | 4 |
| Longest Run Prob. | 0.473586 |
| Converted | 0 |
| Total Runs | 31 |
| Prob | 0.302833 |
The results of the parametric test are similar to those of the test in (1) above. The non-parametric tests shows a slightly lower probability of attaining 31 runs by chance but this value is still not enough to reject H0.
3. Testing serial randomness in the presence of a non-random segment set to be different from the mean value.
Duplicate data1,data3
data3[10,14]=0
To run both tests on this wave execute:
StatsSRTest/T=1/Q/P/NP data3
The results are displayed in the Serial Randomness Test table:
| N | 50 |
| s2 | 13.268 |
| ss2 | 5.61904 |
| C | 0.576496 |
| Critical | 0.228249 |
| P-Value | 3.07736e-06 |
| Runs Up | 16 |
| Runs Down | 15 |
| Unchanged | 1 |
| Longest Run | 4 |
| Longest Run Prob. | 0.473586 |
| Converted | 0 |
| Total Runs | 31 |
| Prob | 0.302833 |
As expected, the non-parametric results remain unchanged but the parametric test statistic C exceeds the critical value and so H0 must be rejected. This illustrates a major deficiency of the parametric test in that it is less likely to fail if the non-random sections have values sufficiently close to the mean.
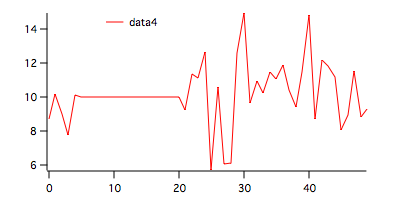
4. Testing in the presence of a very long non-random segment.
We used the following commands to create the input wave:
Duplicate data1,data4
data4[5,20]=10
To run both tests on this wave execute:
StatsSRTest/T=1/Q/P/NP data4
The results are displayed in the Serial Randomness Test table:
| N | 50 |
| s2 | 3.08189 |
| ss2 | 2.88656 |
| C | 0.063382 |
| Critical | 0.228249 |
| P-Value | 0.325941 |
| Runs Up | 13 |
| Runs Down | 13 |
| Unchanged | 1 |
| Longest Run | 15 |
| Longest Run Prob. | 3.15448e-12 |
| Converted | 1 |
| Max Runs | 27 |
| Min Runs | 25 |
| Mean Runs | 26 |
| Max Prob | 0.0303374 |
| Min Prob | 0.005209 |
| Mean Prob | 0.005209 |
In this case, despite the presence of a very long constant segment, the parametric test does not reject H0. On the other hand, the non-parametric test indicates a vanishing probability of the longest run being that long by chance and (all) run probabilities are too low to accept H0.
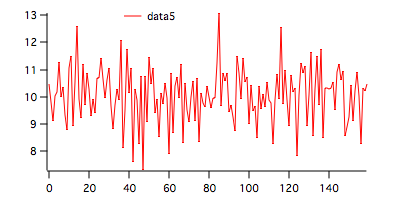
5. Testing longer waves.
If the wave that you are testing exceeds 150 points, the parametric test uses the normal approximation to calculate the critical value and the P-value. If your wave has more than 100 points then the non-parametric test uses the normal approximation for the runs up and down distribution. For example,
Make/O/N=160 data5=10+gnoise(1)
StatsSRTest/T=1/Q/P/NP data5
| N | 160 |
| s2 | 0.994158 |
| ss2 | 1.04365 |
| C | -0.0497789 |
| Normal Approx Z | -0.631623 |
| Critical | 1.64485 |
| Runs Up | 52 |
| Runs Down | 52 |
| Unchanged | 0 |
| Longest Run | 4 |
| Longest Run Prob. | 0.885759 |
| Total Runs | 104 |
| Normal Approx Z | -0.439999 |
| Critical | 1.64485 |

Forum

Support

Gallery
Igor Pro 10
Learn More
Igor XOP Toolkit
Learn More
Igor NIDAQ Tools MX
Learn More