You can remove baselines (or "backgrounds") from data by either by including a baseline function when fitting a sum of functions to the data, or by actually subtracting a baseline estimate from the data.
Baseline Fitting
When the number of peaks is small, a baseline estimation function can be included in the sum of functions and fit to the data along with the peak functions.
This approach is described in Multi-peak Fitting, which fits a cubic polynomial as a baseline estimate.
Baseline Subtraction
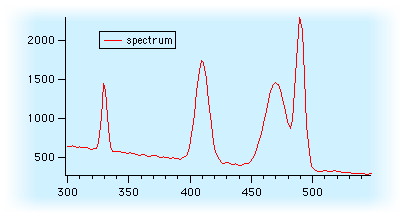
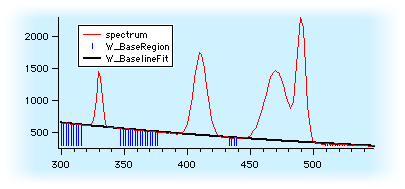
When measuring a large number of peaks, it is often more effective to subtract an estimated baseline from the data.
The estimate is constructed by fitting a function, such as a low-order polynomial, to the data only where it appears to contain no peaks. Igor Pro®´s "Data mask wave" can be used to mark the baseline areas of the data that are used in the curve fit. Then the resulting curve fit result is subtracted from the data. The difference then contains only peak data.
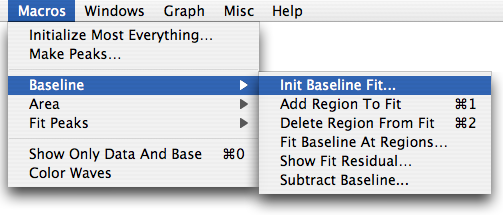
You can use the TN020 Procedures.ipf procedure file (part of Technical Note #020 Peak Measurement and Fitting) to subtract a baseline using this approach. Open the procedure file and initialize the routines by identifying the peak+baseline data:
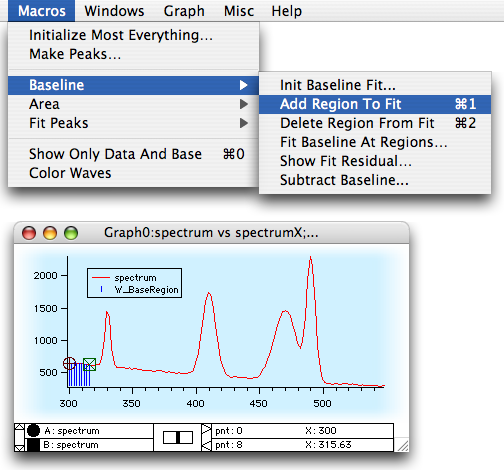
A series of baseline areas are indicated with Igor´s two cursors and Add/Remove menu selections:
Then a baseline function is chosen and fit to the baseline areas:
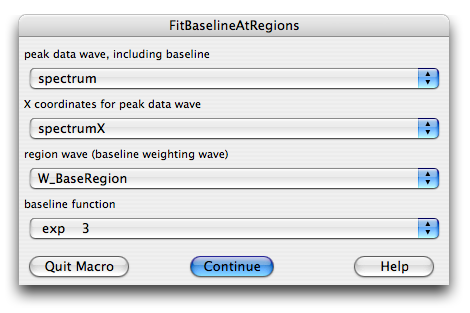
Then choose Subtract Baseline menu item to leave only the peak data:

Forum

Support

Gallery
Igor Pro 10
Learn More
Igor XOP Toolkit
Learn More
Igor NIDAQ Tools MX
Learn More