Scheffe's test is a parametric multi-comparison procedure which tests the hypotheses that the means of each pair of waves are equal. In this example we consider the following six waves:
| data1 | data2 | data3 | data4 | data5 | data6 |
| 36.34 | 58.55 | 50.42 | 41.41 | 47.81 | 38.17 |
| 52.08 | 57 | 40.04 | 64.21 | 46.28 | 36.96 |
| 50.09 | 44.9 | 41.77 | 58.33 | 59 | 38.28 |
| 37.81 | 52.66 | 42.61 | 60.37 | 55.73 | 33.13 |
| 58.98 | 67.99 | 37.75 | 55.32 | 54.58 | 39.97 |
| 63.93 | 52.98 | 41.42 | 55.75 | 43.74 | 47.99 |
| 37.55 | 51.1 | 39.48 | 63.74 | 59.02 | 49.66 |
| 40.64 | 47.96 | 43.79 | 67.86 | 46.75 | 42.51 |
1. Basic Scheffe's test.
To run the test execute the command:
StatsScheffeTest/T=1/Q data1,data2,data3,data4,data5,data6
The results are displayed in the Scheffe Test table:
| Pair | Diff | SE | S | Sa | Conclusion |
| data6_vs_data1 | -6.34375 | 3.61625 | 1.75424 | 3.4912 | 1 |
| data6_vs_data2 | -13.3087 | 3.61625 | 3.68027 | 3.4912 | 0 |
| data6_vs_data3 | -1.32625 | 3.61625 | 0.366748 | 3.4912 | 1 |
| data6_vs_data4 | -17.54 | 3.61625 | 4.85033 | 3.4912 | 0 |
| data6_vs_data5 | -10.78 | 3.61625 | 2.98099 | 3.4912 | 1 |
| data5_vs_data1 | 4.43625 | 3.61625 | 1.22676 | 3.4912 | 1 |
| data5_vs_data2 | -2.52875 | 3.61625 | 0.699275 | 3.4912 | 1 |
| data5_vs_data3 | 9.45375 | 3.61625 | 2.61424 | 3.4912 | 1 |
| data5_vs_data4 | -6.76 | 3.61625 | 1.86934 | 3.4912 | 1 |
| data4_vs_data1 | 11.1962 | 3.61625 | 3.0961 | 3.4912 | 1 |
| data4_vs_data2 | 4.23125 | 3.61625 | 1.17007 | 3.4912 | 1 |
| data4_vs_data3 | 16.2138 | 3.61625 | 4.48359 | 3.4912 | 0 |
| data3_vs_data1 | -5.0175 | 3.61625 | 1.38749 | 3.4912 | 1 |
| data3_vs_data2 | -11.9825 | 3.61625 | 3.31352 | 3.4912 | 1 |
| data2_vs_data1 | 6.965 | 3.61625 | 1.92603 | 3.4912 | 1 |
The table indicates that hypotheses μ6=μ2, μ6=μ4 and μ4=μ3 must be rejected while the remaining hypotheses for the equality of the means are accepted.
2. Testing multiple contrasts.
The contrast hypothesis is defined by a contrast wave. For example, if

denotes the mean of the wave datai then to test the hypothesis
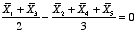
We start by creating the contrast wave:
Make/N=6/O cWave={1,2,1,2,2,1}
Next we execute the test:
StatsScheffeTest/T=1/Q/CONW=cWave data1,data2,data3,data4,data5,data6
The results are displayed in the Scheffe test table (shown here transposed):
| Difference | 11.3196 |
| SE | 2.08784 |
| S | 5.42167 |
| Salpha | 3.4912 |
| Conclusion | 0 |
As the statistic S exceeds the critical value Salpha we reject the contrast H0.

Forum

Support

Gallery
Igor Pro 10
Learn More
Igor XOP Toolkit
Learn More
Igor NIDAQ Tools MX
Learn More