The Kendall Tau test computes a correlation coefficient (tau) similar to Spearman's correlation coefficient by ranking all possible pairs of entries. A tau value of 1 implies that the data is ordered perfectly according to rank while a tau value of -1 implies that the data is reverse ordered according to rank. In the examples below we generate various sets of data and compute Kendall's tau.
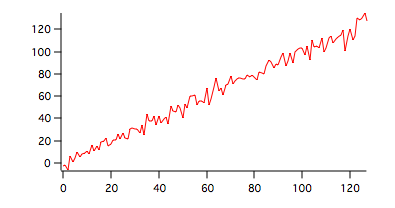
1. Increasing function with low level noise.
To generate the data execute the following command:
Make wave1=x+gnoise(15)
To compute Kendall's Tau for the data shown above execute the following command:
StatsKendallTauTest/T=1 wave1
The results are shown in the table:
| N | 128 |
| tau | 0.7618 |
| svar | 0.00356 |
| zscr | 12.753 |
| pValue | 2.968e-37 |
Positive Tau as expected for a generally increasing function.
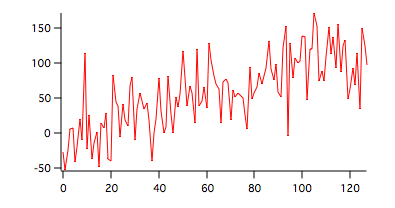
2. Increasing function with high level noise.
To generate the data execute the following command:
wave1=x+gnoise(35)
StatsKendallTauTest/T=1 wave1
The results are shown in the table:
| N | 128 |
| tau | 0.5366 |
| svar | 0.00356 |
| zscr | 8.984 |
| pValue | 2.598e-19 |
Positive Tau but smaller than the example above because the level of the noise high relative to the range of x.
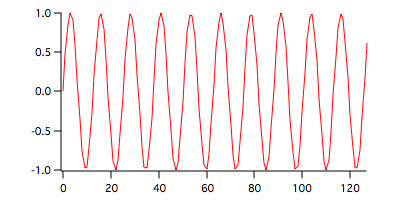
3. Periodic function
wave1=sin(x/2)
statsKendallTauTest/T=1 wave1
The results are shown in the table:
| N | 128 |
| au | -0.0393701 |
| svar | 0.00356791 |
| zscr | -0.659112 |
| pValue | 0.509824 |
In this case Tau is close to zero becacuse the function is periodic so the ordering of ranks results in negligible Tau value with a sign that depends on the phase of the periodic signal.

Forum

Support

Gallery
Igor Pro 10
Learn More
Igor XOP Toolkit
Learn More
Igor NIDAQ Tools MX
Learn More