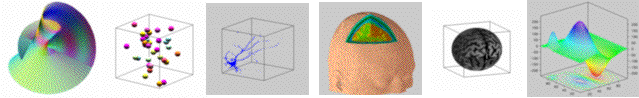
Igor Pro® provides a number of tools for visualizing surfaces and volumetric data. Typical surface plots consist of wireframe or filled surfaces that represent a two-dimensional distribution of scalar values. Scatter plots represent an arbitrary distribution of positions in 3D space. Isosurfaces and voxelgrams represent locations in 3D space where the scalar values are equal to some constant. Parametric surfaces are wireframe or filled shapes where the surface definition is a function of external parameters. 3D object plots are rendered 3D scenes that are built from a number of built-in 3D primitives. Volume slices are used to visualize 3D data by displaying one or more slices through the domain occupied by the data.
3D Tools
Igor has two main tools for displaying 3D and volume data. They are Gizmo and the 3DWaveDisplay procedures. Gizmo is a versatile external module that uses OpenGL technology to render 3D scenes. The 3DWaveDisplay procedures are used to display orthogonal slices from volumetric data. The table below lists the types of graphs that you can create for each type of data.
| Data Format | Type of Graph | Tool |
| 2D Matrix | WireFrame | Gizmo |
| Filled Surface | Gizmo | |
| Intersecting Surfaces | Gizmo | |
| X, Y, Z Data | 3D Scatter | Gizmo |
| 3D Path Plot | Gizmo | |
| 3D Scatter and Surface | Gizmo | |
| Ribbon Plots | Gizmo | |
| Volumetric Data | 3 Projections | 3DWaveDisplay Procedures |
| Orthogonal Slices | Gizmo | |
| Isosurfaces | Gizmo | |
| Voxelgrams | Gizmo | |
| Arbitrary 3D Objects | 3D Scenes | Gizmo |
Gizmo Tutorials
The following video tutorials demonstrate elementary and advanced features of Gizmo
Introduction:
Techniques:
- Creating a Surface Plot from Scatter Data
- Creating a Parametric Surface
- Creating Slices of Volumetric Data
- Using Clipping
- Adding Transparency
- Lights and Shading
Advanced:

Forum

Support

Gallery
Igor Pro 10
Learn More
Igor XOP Toolkit
Learn More
Igor NIDAQ Tools MX
Learn More