Help taking an integral within a Function I want to plot


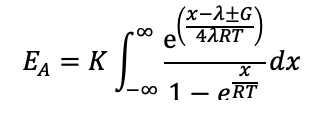
Hi, I am trying to plot the attached equation. I want to make a plot with E_A on the y-axis and G on the x-axis. However, I am struggling to determine the best method for coding the integral over x. Every other variable is a constant. Do I need to do this as a 2-D wave? Thanks
My suggestion ...
First, code the function inside the integral. Code it to return to a wave dEAx<-Function fdEAx(G,lambda,T,x). Set the scale on dEAx to large values of -start to +end.
Plot dEAx as a function of x for a fixed value of G (lambda, T). Code a function that will integrate dEAx. Report the last point of that function.
Now, run the sequence
* generate a dEAx(G) curve
* integrate it
* capture the end point of the integration to a new wave iEA(G) for the given G value
Continue above for a range of G of interest.
May 30, 2019 at 12:55 pm - Permalink
My approach is dated; I recommend using pen and paper to rewrite the integral. Start by re-writing the exponential in the numerator as a couple of factors (one of which can come out of the integral). Then make a change of variable say f=x/RT. You should now have a simple integrand that you can evaluate at three critical points: x=-INF,0,INF. The result of this will indicate how to proceed.
A.G.
May 30, 2019 at 01:48 pm - Permalink
Dated but timeless AG. :-)
May 30, 2019 at 06:23 pm - Permalink