Help with zero offset


Hi all, I have an issue I can't wrap my head around at the moment, and can't find suitable answers I can piece code together from on here.
I have datasets which have depth sensor data, the animal regularly returns to the surface of the water but cannot be above the water.
There is 0.5m allowance on the sensor resolution but one data set has a 22m offset which drifts over time to -3.5m offset.
The data is sampled every 5 seconds starting 2015-04-14 11:10:00 for approx 6 months. Sample attached and short clip here:
Depth,Temperature,Light_Level
112.5,23.25,127
113.5,23.25,127
113,23.25,127
112.5,23.299999,127
111.5,23.299999,127
111.5,23.299999,126
111,23.35,126
110,23.35,126
109.5,23.35,128
109.5,23.400002,129
108.5,23.450001,129
108,23.549999,129
I want to use a 3 day moving average of minimum depth calculated each day (which should be 0) to correct the depth data points by the moving average.
The final step would then be to turn all remaining negative values to 0 so no data is above the surface of the water.
Any help would be much appreciated
This would be one way of doing it:
You could also use a for loop or maybe even MatrixOP. There are many options.
July 5, 2021 at 05:21 am - Permalink
It might be easier to understand like this, but like this it will try to access points before 0 and after 999 and therefore crash. The messier looking version with Min() and Max() prevents that.
July 5, 2021 at 05:24 am - Permalink
In reply to This would be one way of… by olelytken
Ig0r_newbieHi olelytken,
Thanks for your response. I've run your code and it works for the dummy wave, then modified for my depth wave. After a long painful afternoon of problem solving, I have a working solution.
I had to convert my date&time wave into numerical, make the start point 0 and set the scaling to 1, then reconvert after making the box into date&time and adjust the scaling & start point back.
I didn't get any warnings or issues with out-of-bounds using the shorter code, so just stuck with it for simplicity and used DimSize to give the N value for the depth wave.
Is there a way to read the scaling, '3511822200' and delta '5' value from the wave, so i can automate that for all datasets also?
Many thanks
July 6, 2021 at 03:11 am - Permalink
You can look at the help for WaveMin to see how to convert between X and points. You can also look at the help for DimDelta and DimOffset
July 6, 2021 at 03:22 am - Permalink
In reply to You can look at the help for… by olelytken
Ig0r_newbieThanks, appreciate the help and the directions on where to look. Works very nicely, I'm not 100% sure on the calculations behind it but it gives me a great min depth wave which I can use along with the wave arithmetic panel to correct the depth wave drift back to 0 for both positive and negative numbers.
I am still confused by your writing for box size though, you wrote 'The actual size of the box will be 1+3*2 = 7 in this case
Variable BoxSize=3' I don't understand where your calculation came from, I understand you were working on a numerical wave case but still don't see where 7 came from, and then you put 3 on the variable. What am I missing?
Thanks
July 7, 2021 at 12:58 am - Permalink
The WaveMin() calculation is done for each point in MinDepthWave_3day. Let's consider point 10 in MinDepthWave_3day as an example: Point 10 will be calculated as WaveMin(Depth, 10-BoxSize, 10+BoxSite) = WaveMin(Depth, 7, 13) meaning the smallest number of seven points: 7,8,9,10,11,12,13.
July 7, 2021 at 02:23 am - Permalink
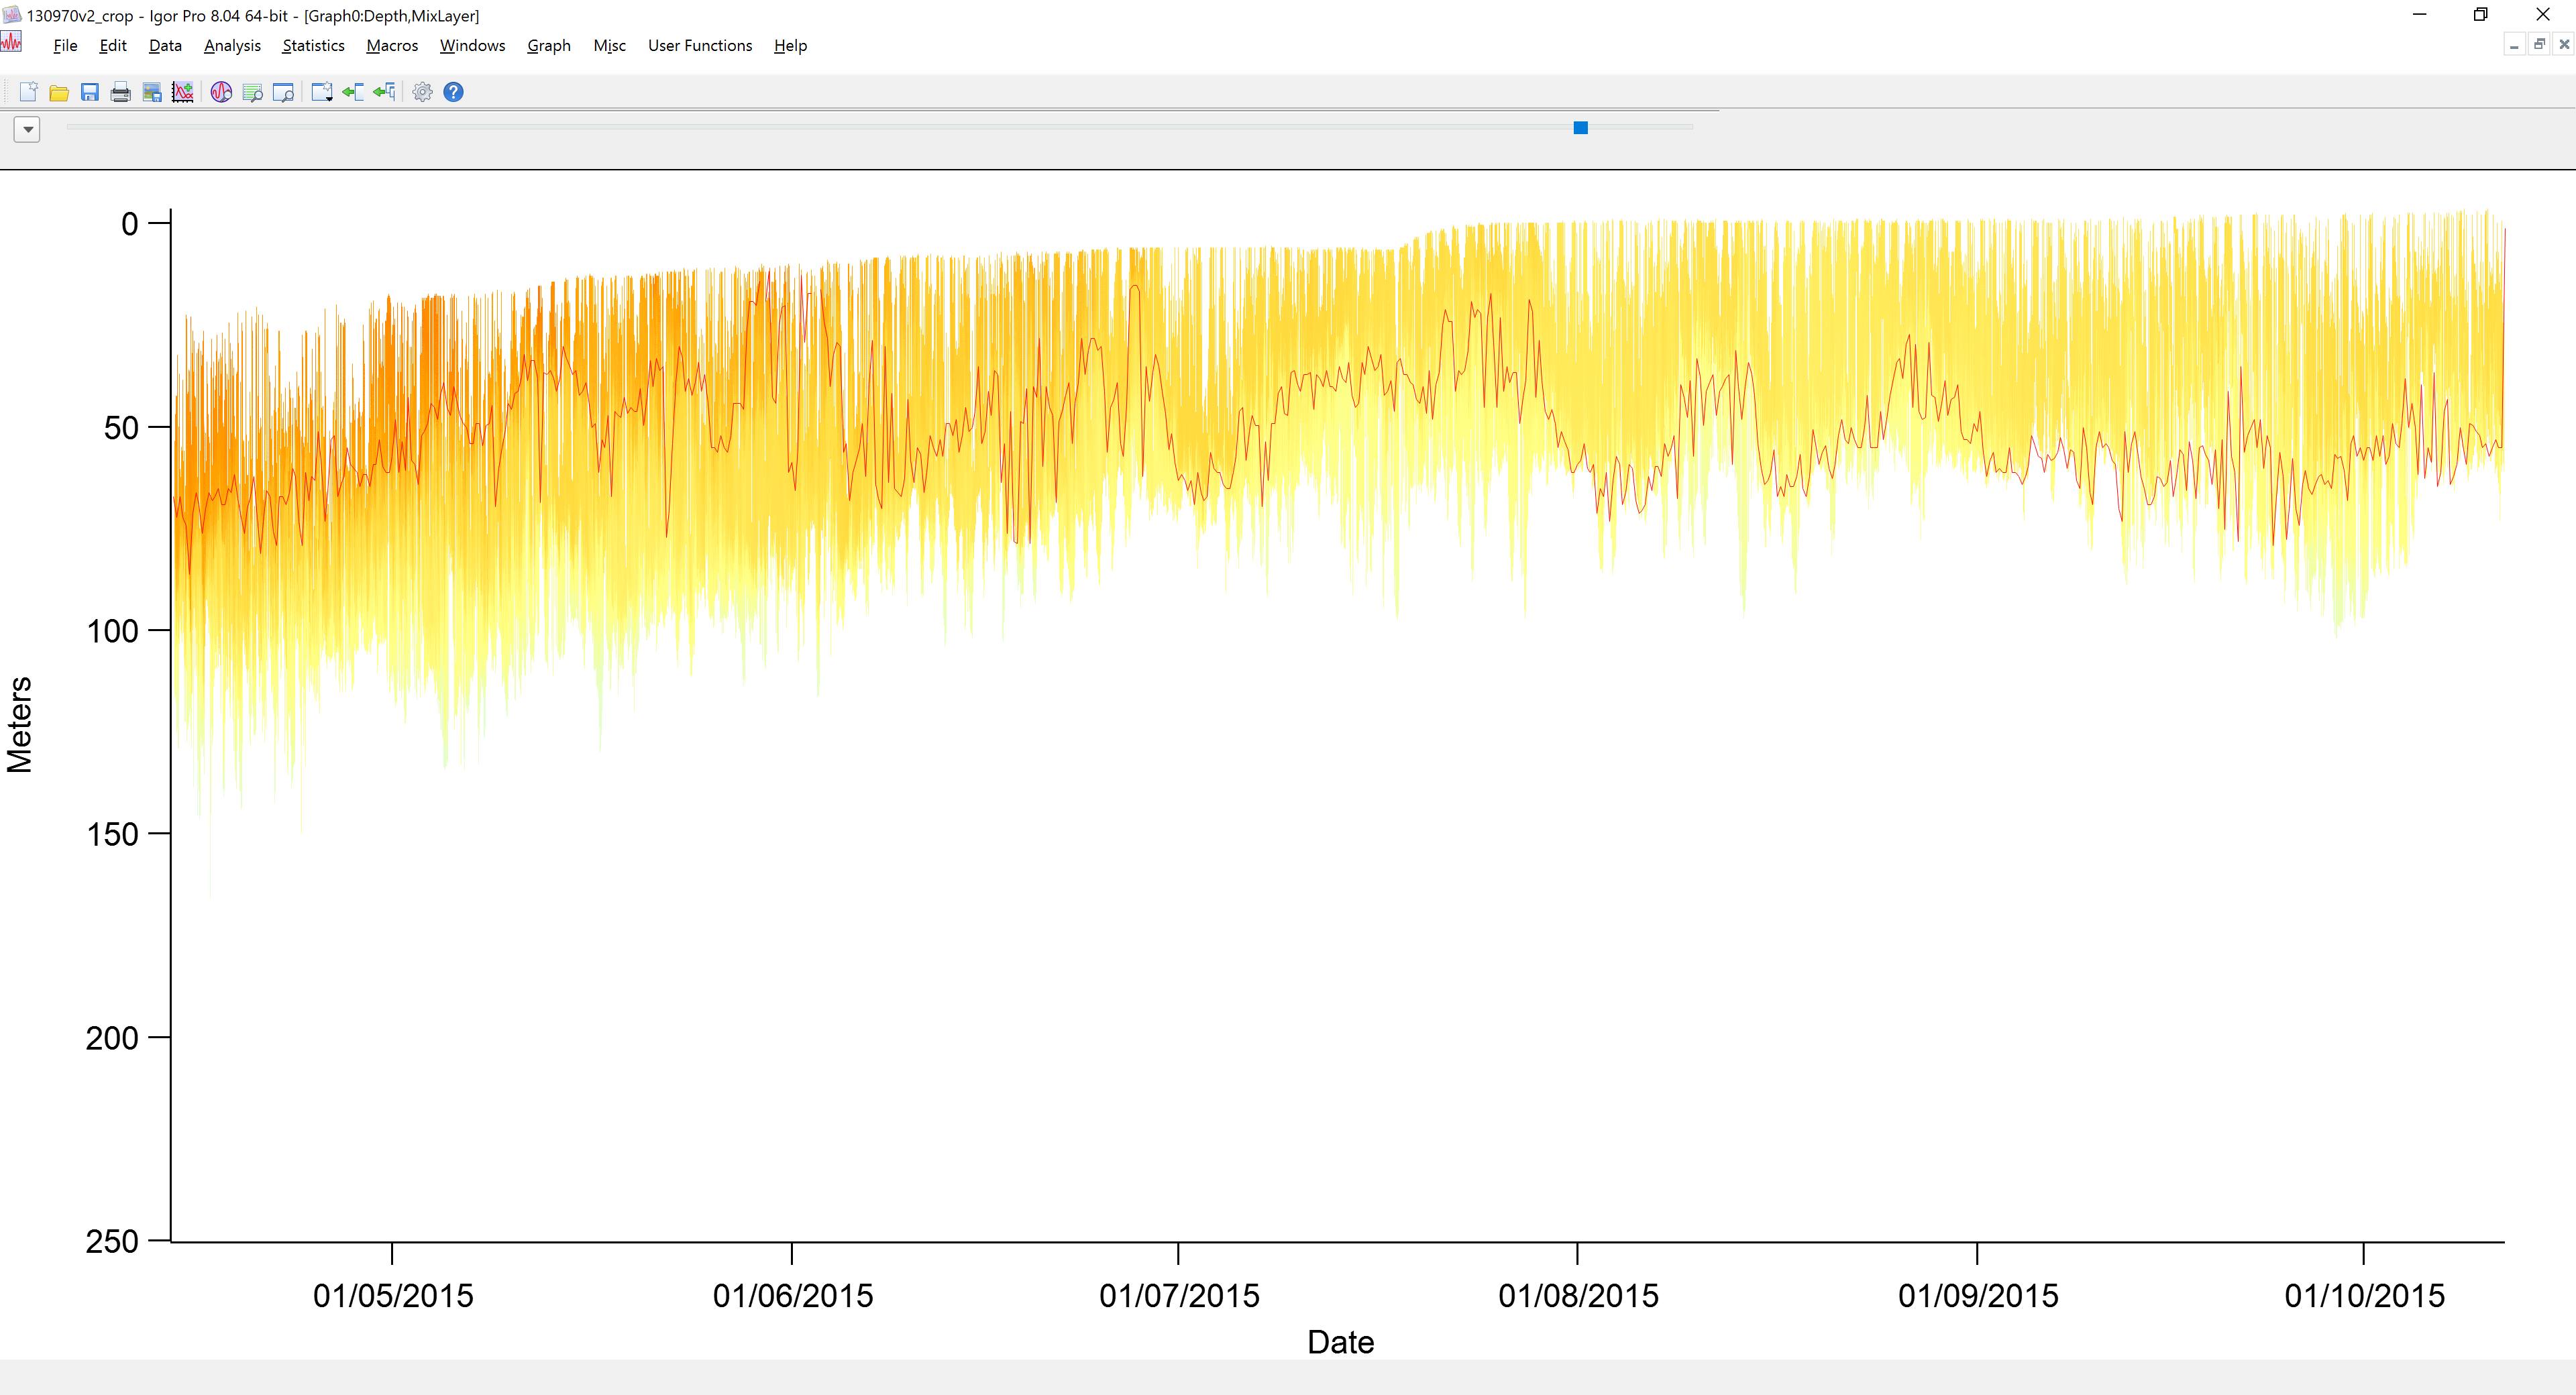
So, the final stage, I looked at the data and chose a 6 hour wave to best represent the minimum depth values. I created a 6 hourly mean from that minimum depth wave to smooth it, and use the wave arithmetic panel to subtract it from the main depth wave, thereby correcting the offset back to zero.
The final stage is now to remove the few anomalies which are still less than 0. Is there a function for something like this, smoothing? or would I have to write a for loop that replaces any negative value with 0?
July 9, 2021 at 01:41 am - Permalink
To change all negative values to 0 you could do something like this
or this
or this
July 9, 2021 at 04:14 am - Permalink