Interpolating 2D matrix (Heat Map) with uneven step size on axis


I have a series of spectra that I have taken at multiple temperatures and want to make a heat map of the data as follows: x-axis (energy), y-axis(temperature), z-axis (intensity)
I have been able to make a decent heatmap by appending all the spectral intensity data into one 2D matrix and plotting this 2D wave versus my two axes, where I also took into account the need for one extra data point for both 1D waves used as the axis in order to give the sufficent endpoints for the pixels. This result is okay, but I am now trying to interpolate this result in order to have less blocky pixelated look caused by the large gaps in my temperature series.
I have many different attempts with imageinterpolate, but I am primarily running into the issue of being able to keep my axis consistent with the true data points which are unevenly spaced (ie: 4,15,30,40,50,55,58,....150,200). When I do interpolate the image my resulting axes just turns into 0-16 for the 16 different temperatures I have rather than the actual temperature range of 4-200.
How can I best accomplish a smoother looking heatmap that retains the data used at its actual values for the axis?
I'm starting to think that I will need to do a linear interpolation of the intensity values across the y series (temp) to fill in the data gaps I have, but if there is another solution, please let me know!
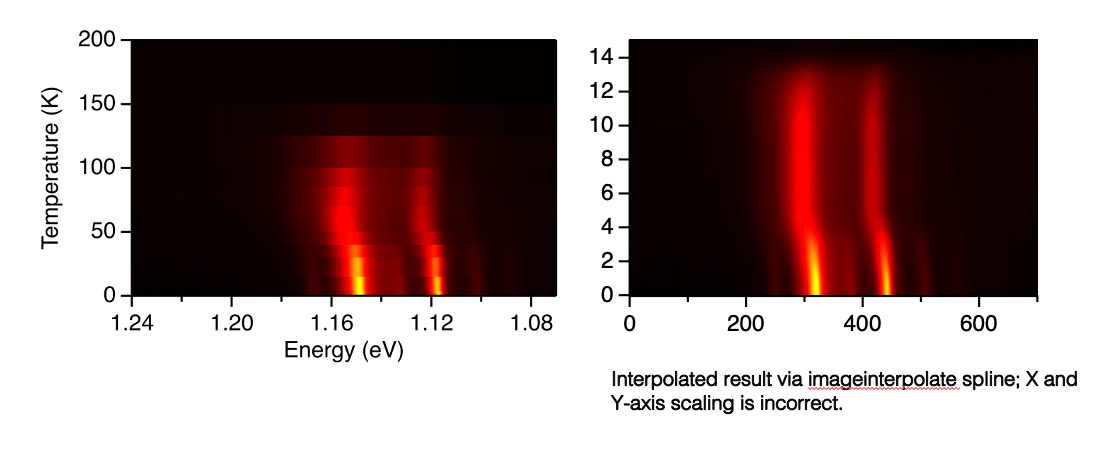
You can use the /S option with ImageInterpolate to specify the scaling of the new image you are trying to create, for instance /S={1.07,0.001,1.24,0,1,200} might work with your ranges
April 5, 2022 at 07:31 pm - Permalink