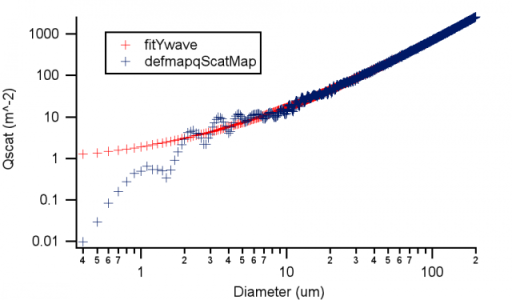
Loess smooth curve with large range
Loess/DEST=fitYWave /DFCT/SMTH=(0.2) srcWave=defmapqscatmap, factors={defmapqscatdiams}The attached graph shows the output (and the two input waves are also attached). It doesn't seem to matter what parameters I give to Loess, I always end up missing the fit at small diameters. The object of the exercise is to come up with some curve which follows the overall shape of the blue curve, but which increases monotonically. I'm pretty sure the problem arises from using a least squares fit over such a huge range of Y values.
I've also tried using a low pass filter to smooth the curve, but that tends to result in undershooting at small diameters. I'm sure there must be something obvious I should be doing, but I really can't find it. Anyone?


You may need to use Loess on the log of your data.
Better would be a curvefit to an actual model of your data. Loess is a rather brute-force approach; it knows nothing about the science underlying your data.
--Jim Prouty
Software Engineer, WaveMetrics, Inc.
June 9, 2011 at 12:09 pm - Permalink
EDIT: To clarify, the blue line *is* a model of my data - I didn't show the actual data on the attached plot.
June 10, 2011 at 02:11 am - Permalink