One curve, two axes


I have a question about whether or not there is another shortcut to generate the following graph.
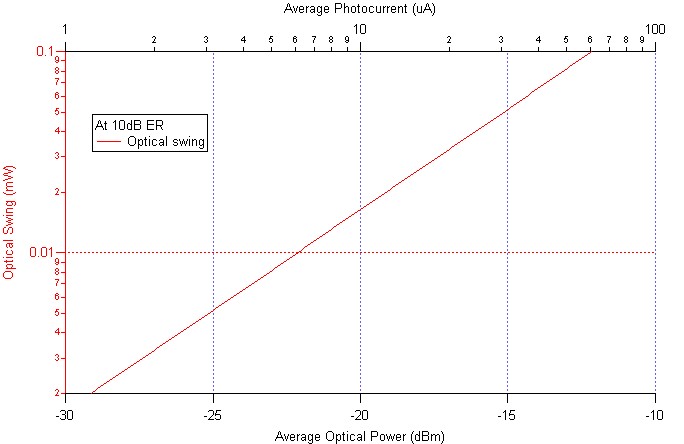
It has two copies of the same WAVE, but the top and bottom axes provide the same abscissa information, but in a scaled form.
In this case, it is Optical Power on the BOT axis (linear scale) and average photocurrent on the top axis (log scale).
Thus, in order to generate this plot, there are actually 2 copies of the same wave, one plotted /B vs the POWER wave and one plotted /T vs the PHOTOCURRENT wave.
Is there a way to do this same thing and only have 1 trace in tracenamelist?
I recently found another and potentially much nicer "2-wave" way to do this.
-- Make a dummy wave filled with NaN and plot it on the TOP vs the PHOTOCURRENT wave. The NaN won't change the scale of the LEFT axis.
Any other ideas??
Thanks!
Sean
--Jim Prouty
Software Engineer, WaveMetrics, Inc.
June 17, 2010 at 10:18 am - Permalink