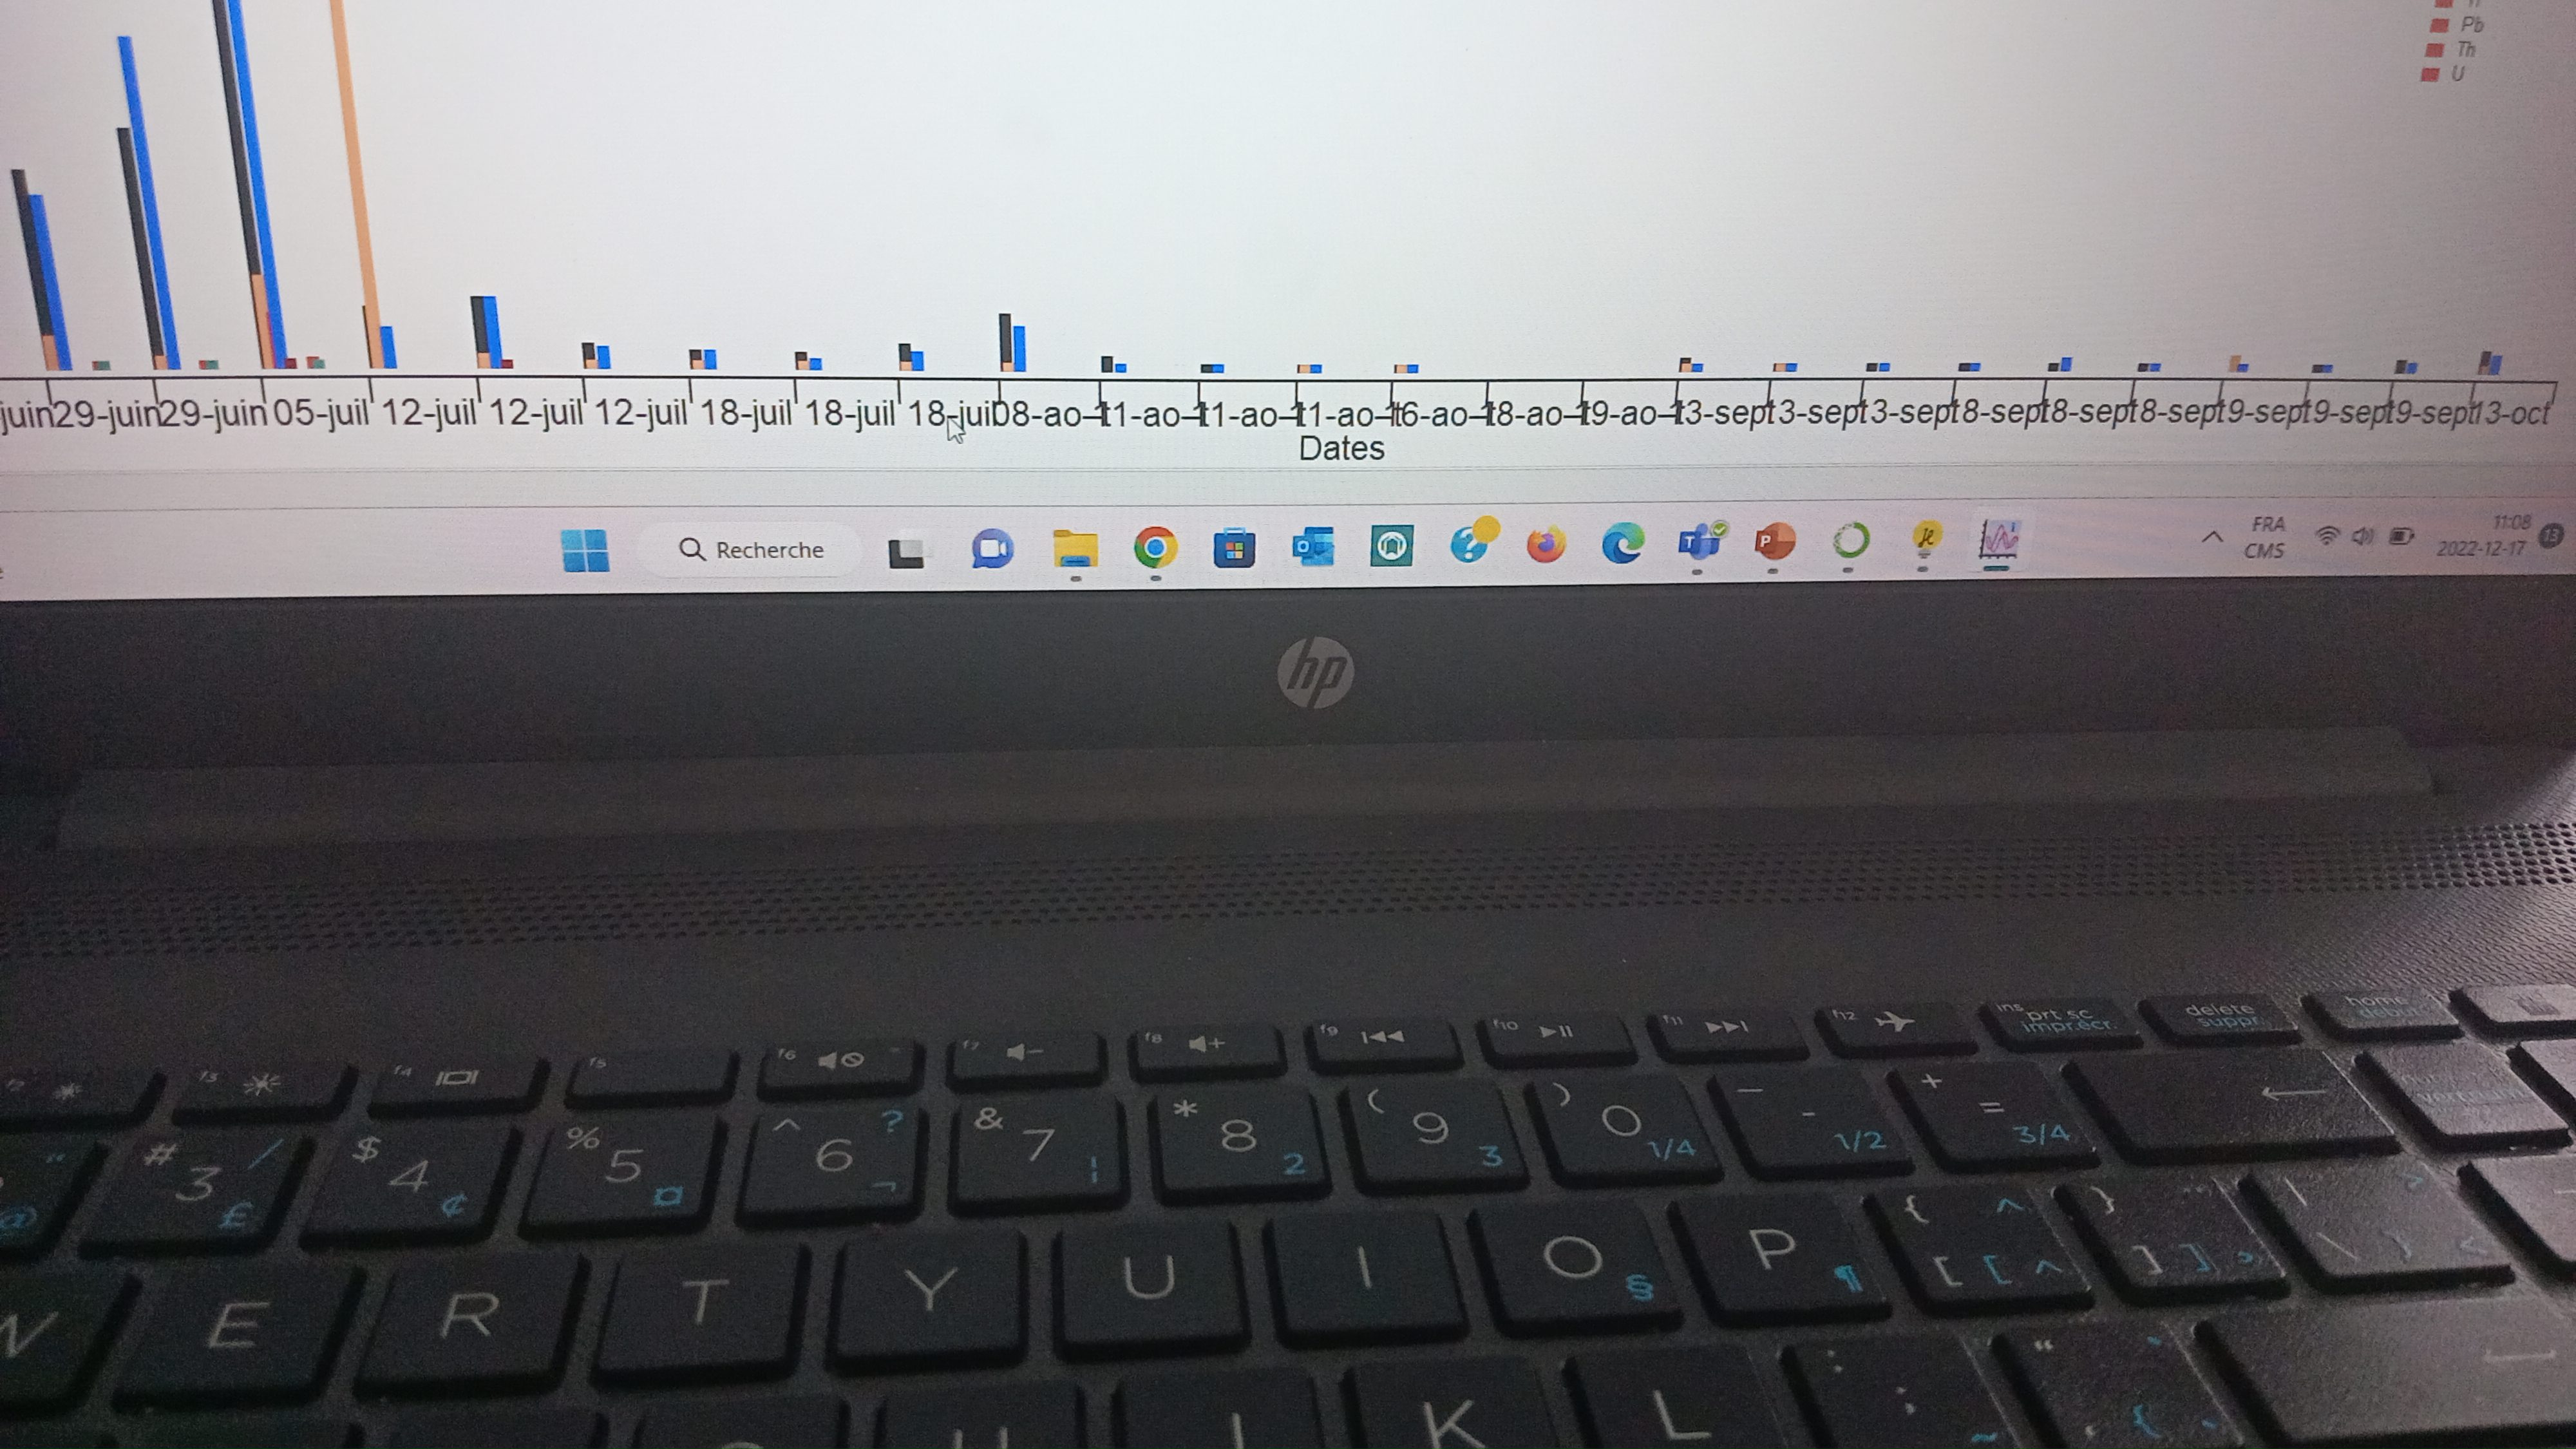
Double-click the bottom axis to open the Modify Axis dialog, choose the "Label Options" tab and change "Tick label rotation" to 90 (degrees). You can also adjust the tick label offset there.
I don't have enough information to advise you about "and I would also like to add on each graph the element that represents it (I would not like the legends to be on the side".
please i have another question I would to create a loops for remove from graph that i did all elements which the concentrations are < 1 (with procedure )
So I create loops as on picture but when I would to execute the commande nothing changes ,i don't know maybe I did some errors?
This function is much like yours, but replaces certain elements of the wave with NaN:
Function blankPointsInWave(WAVE w)
	Variable i
	Variable npnts = numpnts(w)
	for (i = 0; i < npnts; i++)
		if (w[i] < 1)
			w[i] = nan
		endif
	endfor
end
Another way to do that is like this:
w = w[p] < 1 ? nan : w[p]
Perhaps you want to have a wave that simply has all the values that are greater than one, that is, make a shorter wave with just values greater than one. For that, I would use the Extract operation:
Wave w
Extract w, wGT1, w >= 1
By the way, when you post code, you should copy it, click the Insert Code Snippet that you find above the editor window here, and paste your code into the code snippet window. Be sure that Igor is selected as the language before clicking OK. That's what I did here.


Double-click the bottom axis to open the Modify Axis dialog, choose the "Label Options" tab and change "Tick label rotation" to 90 (degrees). You can also adjust the tick label offset there.
I don't have enough information to advise you about "and I would also like to add on each graph the element that represents it (I would not like the legends to be on the side".
December 17, 2022 at 10:34 am - Permalink
Thanks ? ,
please i have another question I would to create a loops for remove from graph that i did all elements which the concentrations are < 1 (with procedure )
So I create loops as on picture but when I would to execute the commande nothing changes ,i don't know maybe I did some errors?
December 19, 2022 at 11:22 am - Permalink
This function is much like yours, but replaces certain elements of the wave with NaN:
Another way to do that is like this:
Perhaps you want to have a wave that simply has all the values that are greater than one, that is, make a shorter wave with just values greater than one. For that, I would use the Extract operation:
By the way, when you post code, you should copy it, click the Insert Code Snippet that you find above the editor window here, and paste your code into the code snippet window. Be sure that Igor is selected as the language before clicking OK. That's what I did here.
December 19, 2022 at 02:15 pm - Permalink