Polar Graph help


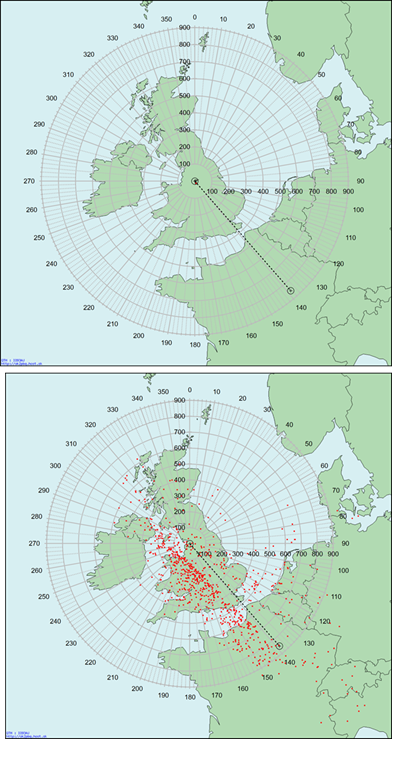
I make extensive use of Polar Graphs for plotting data in range-Azimuth format. I have used a Great Circle map (picture) centred on my location which is inserted as a in the program layer of the graph with DrawPict. The Great Circle map format is limited to one size. The line trace is made from wave points from centre to a point ~ SW 850 km. The map and polar grid are calibrated and as long data are within the radius limits, the grid is fixed with respect to the picture. (Upper plot)
However, when data which extend outside the radius are added using the modify polar graph dialog the grid resizes and the centre move relative to the picture. (Lower plot)
Anty thoughts on how waves can be added and the original grid position retained will be appreciated.
In the polar graph 'Range' tab, try clicking 'Center In Graph'. After doing that, it seems that setting data outside the radius limit no longer shifts the center point of the polar graph.
January 31, 2025 at 10:06 am - Permalink
Thanks Ben - I should have tried that!
... but when I look closer the size of the grid within the window has changed.
Are there any other ways of changing / moving the grid within the window?
February 3, 2025 at 01:01 am - Permalink
On further inspection I find that the window opened by new polargraph is not square. When I append a square picture using drawpict to the polargraph the whole picture is inserted but is not square now. The white area of the window (i.e. not including the top 'banner') is for example 29.2 cm wide and 27.8 cm high. Is this ratio a default format or adjustable? This is enough to throw out alignment of data and grid with the underlying picture.
February 3, 2025 at 04:18 am - Permalink
(I am going to presume you're using Igor 9.05.)
If you append the picture using the 'Append Image...' button on the Main tab, there are facilities for assigning scaling to an image 2-D wave to keep the image aligned with the polar grid.
To start with this, you need to load the picture as an 2D image matrix. Select Data->Load Waves->Load Image to start.
To be clear, you would be replacing your DrawPict on the back layer with an RGB image matrix drawn behind the polar plot.
For more about this, enter:
in any experiment using the New Polar Graphs package.
February 4, 2025 at 10:13 am - Permalink
The trick is to load the graphic into Igor as an image, and use the Polar Append Image Dialog to add the image to the polar graph and set the image's X and Y scaling to match the polar traces that will appear above it.
February 12, 2025 at 10:48 am - Permalink