Remove element from graph with loops


please i have question I would to create a loops for remove from graph that i did all elements which the concentrations are < 1 (with procedure )
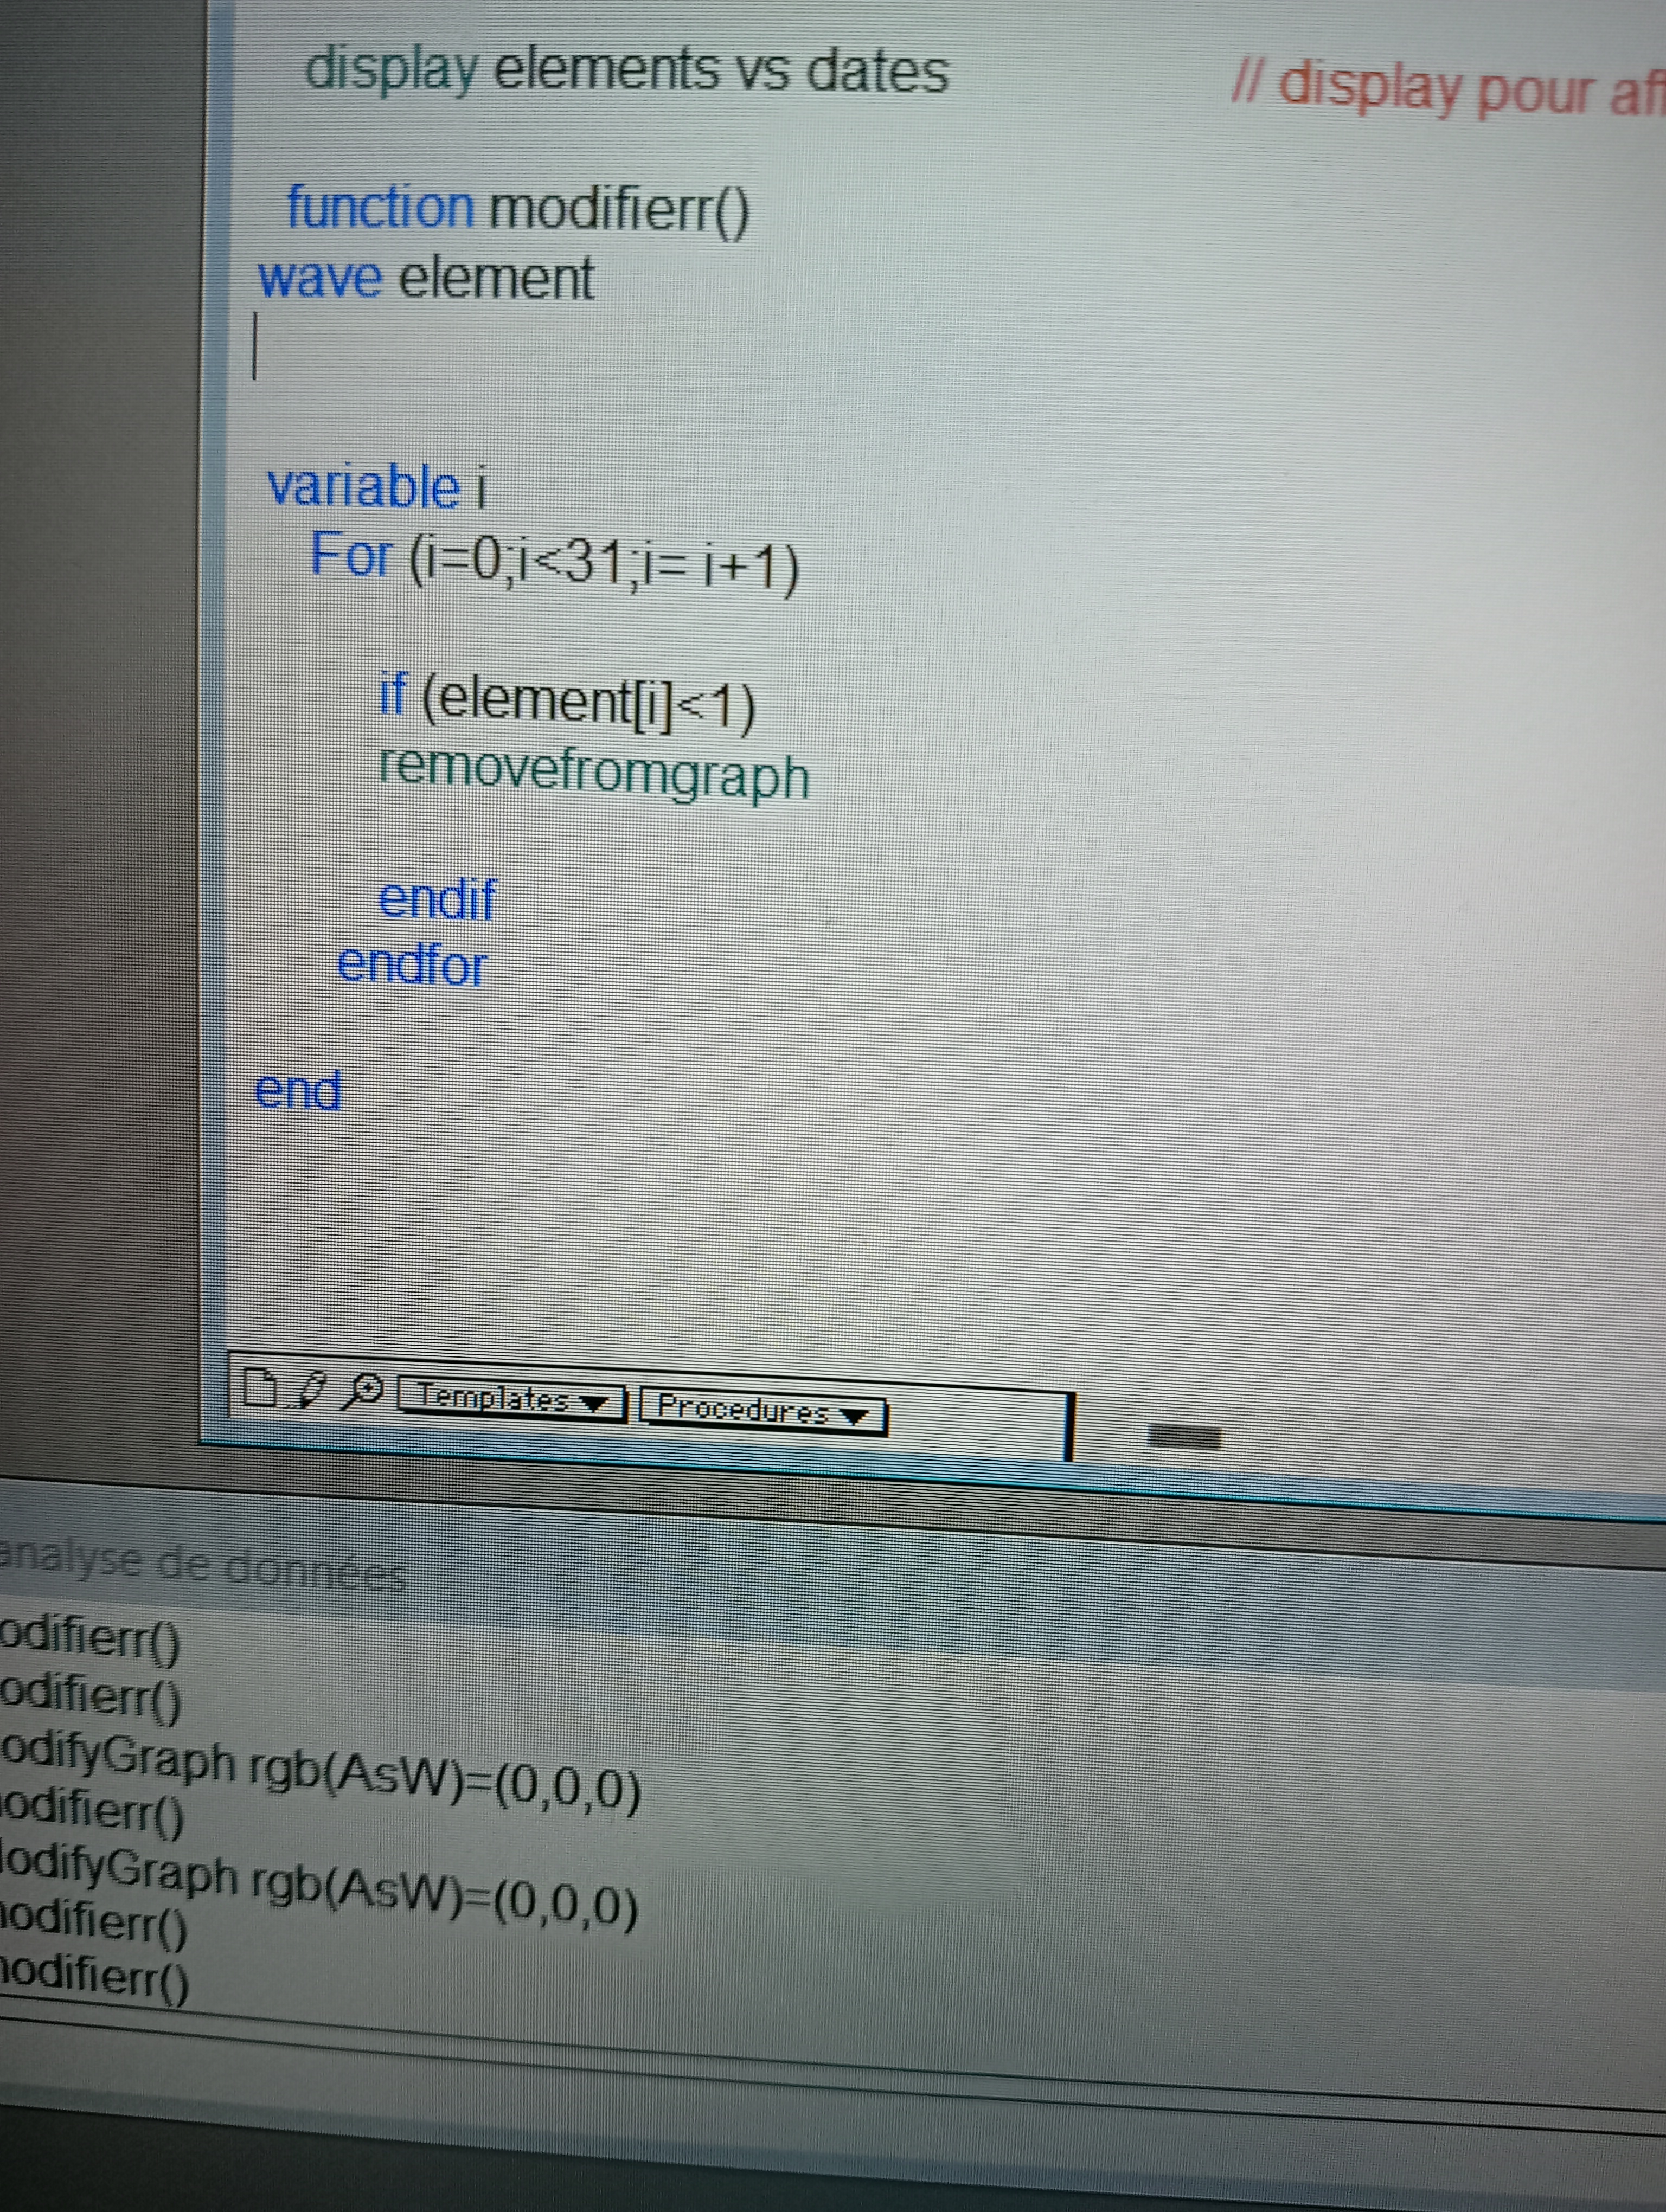
So I create loops as on picture but when I would to execute the commande nothing changes ,i don't know maybe I did some errors?
Do you want to remove the TRACE or do you want to remove a POINT in the TRACE?
RemoveFromGraph removes a TRACE -- the entire data curve
You may instead simply want to set the POINT in the TRACE to disappear on the graph. Do this using NaN (not a number).
Certainly in the latter case you should remember to make a duplicate copy of your data wave before you modify (remove) data points from it.
December 19, 2022 at 01:50 pm - Permalink
Ah. I answered this where you asked it first, but it is better to start a new thread for it. Here is what I posted:
This function is much like yours, but replaces certain elements of the wave with NaN:
Another way to do that is like this:
Perhaps you want to have a wave that simply has all the values that are greater than one, that is, make a shorter wave with just values greater than one. For that, I would use the Extract operation:
By the way, when you post code, you should copy it, click the Insert Code Snippet that you find above the editor window here, and paste your code into the code snippet window. Be sure that Igor is selected as the language before clicking OK. That's what I did here.
December 19, 2022 at 02:17 pm - Permalink
thank you for your answers
in fact I would like to remove from the graph all the traces whose concentrations are <1c by using procedure(if possible they remain on the table) but will be removed from the graph
for this figure for example for the Axis on the left I started from concentration = 1 suddenly all the elements which have concentrations lower than 1 do not appear but on the legends I have all the elements which therefore appear I would like to create a loop that allows me to show on my graph only the elements whose concentration is >1
(John edited this to remove the code snippet windows)
December 19, 2022 at 03:31 pm - Permalink
Is the vertical axis concentration?
Do you want to remove an entire trace if all concentrations in the trace are less than 1?
Do you want to remove an entire trace if any concentrations are less than 1?
Perhaps we will understand better if you post the Igor experiment file instead of posting pictures.
December 19, 2022 at 03:46 pm - Permalink