symbol size: in the legend and on the trace


X-Y plot: To achieve the purpose of symbol size representing relative or actual numerical size on the scatter plot.
I use the :
ModifyGraph zmrkSize(Y_pos)={mark_size,*,*,7,15}
you can also recreate my plot using the attached Graph0_2.txt


The next thing I found difficult was to adding the legend for the display size,
which is not consistent in the legend and plot.
In the attached graph, there are three legends produced in different ways, they all show strange relative scales.
Perhaps I am simply not using the correct method.
Any help would be appreciated.
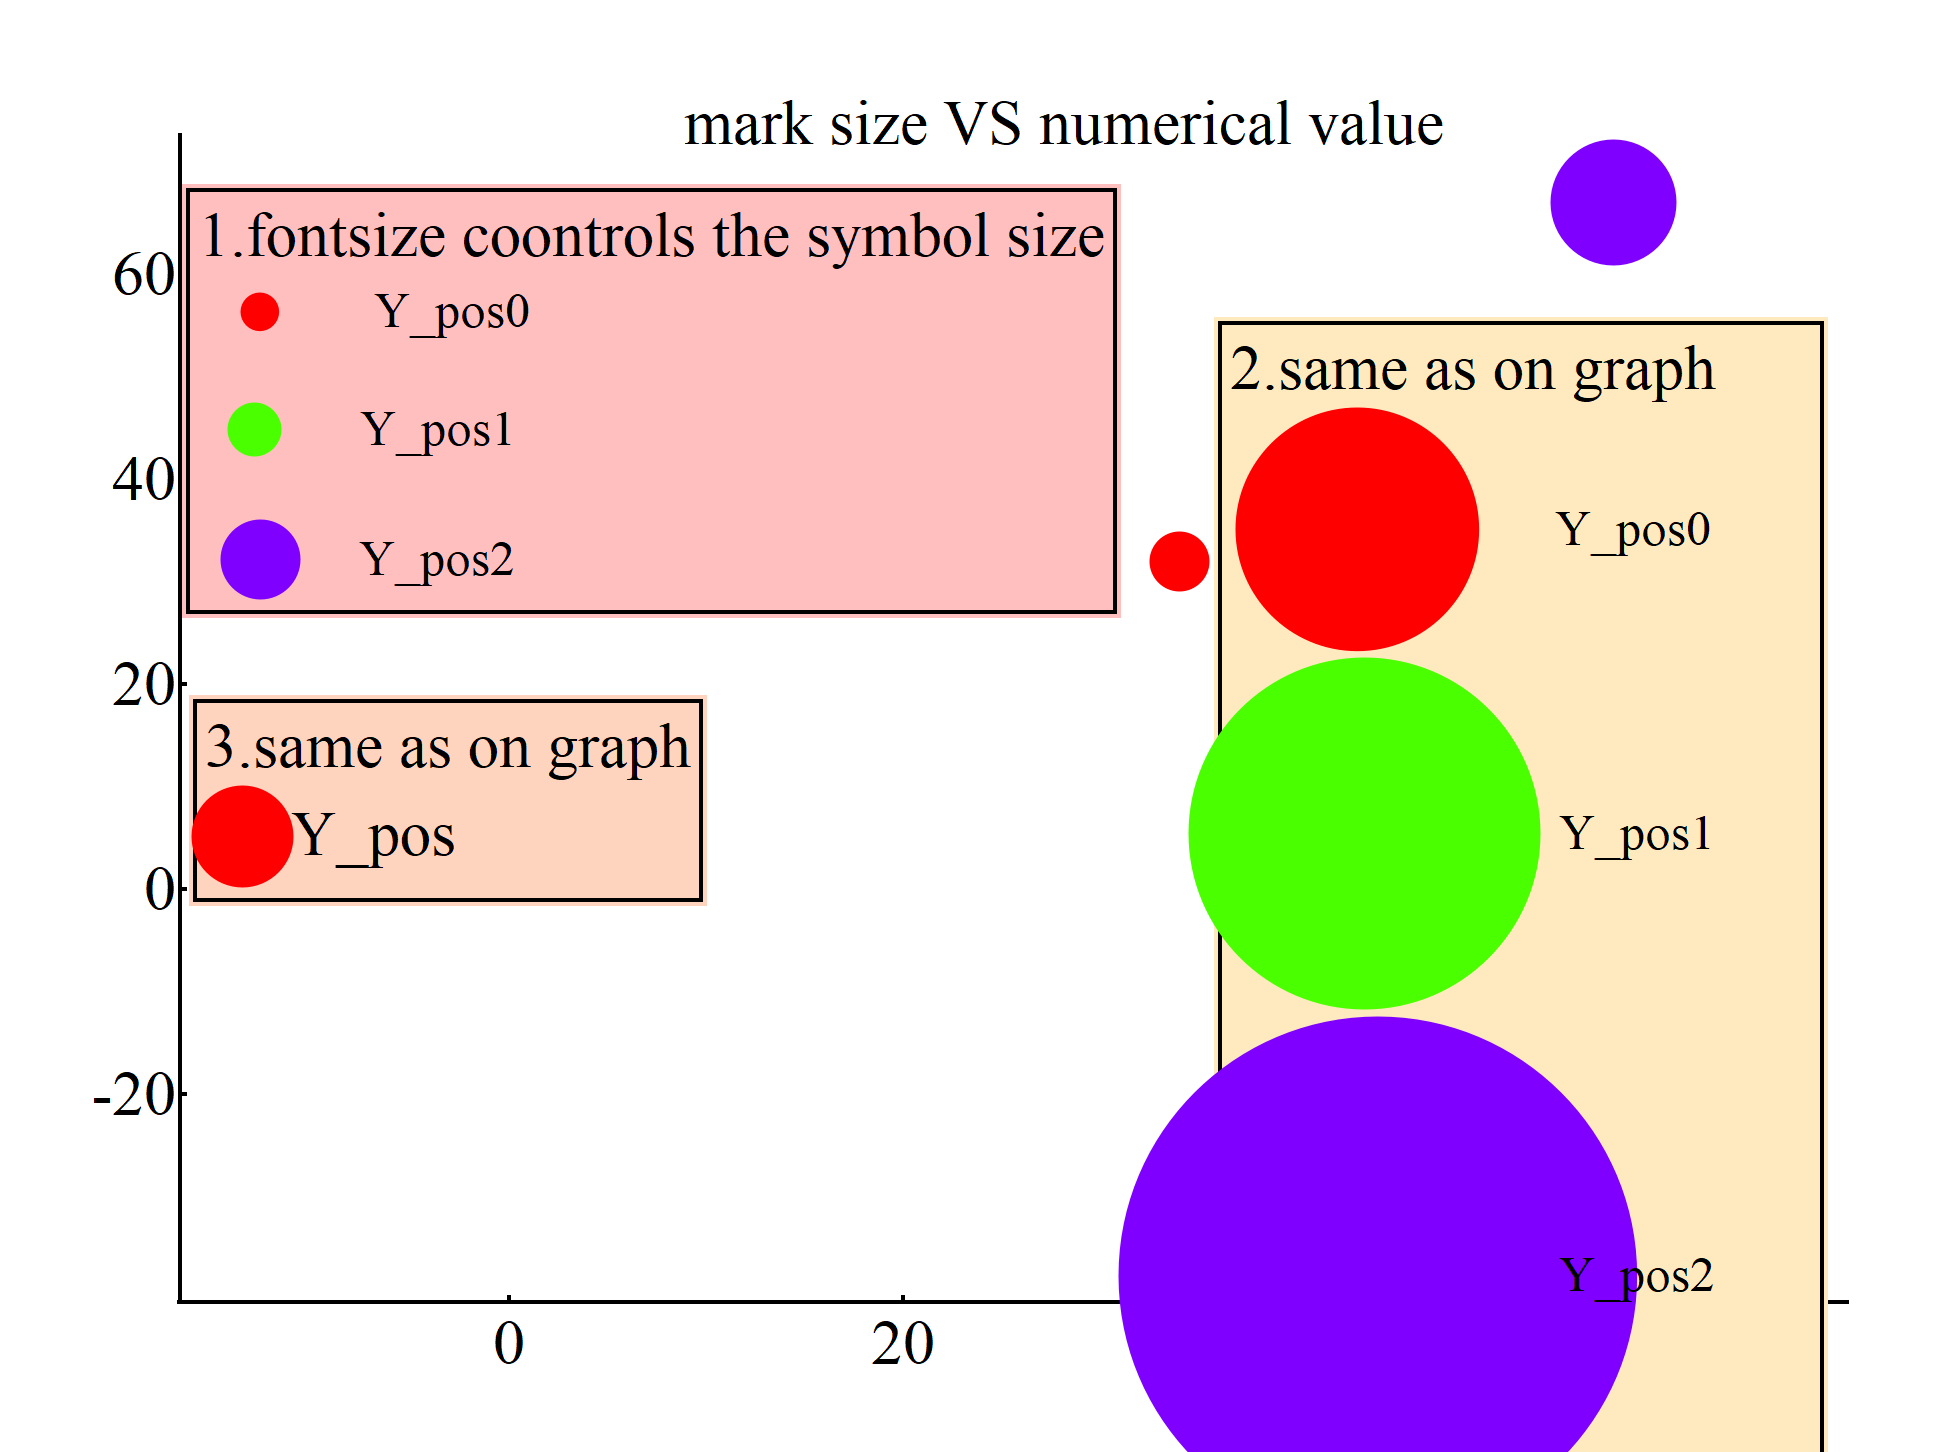
The size and position of the legend also change in unusual ways in the graph window and in the Saved Picture.
July 1, 2023 at 07:53 pm - Permalink
I believe the answer is simple. When you want your printout to retain absolute or relative sizes as well as absolute or relative positions that have a specific relationship to one another, use absolute size / position designations throughout the graph, including for such things as fonts, traces, margins, and tick marks among others. Otherwise, you are essentially giving Igor Pro permission to scale the content in the printout to its own best judgement on relative and absolute sizes / positions. Also, the steps involved to translate an Igor Pro graph displayed on a monitor to a printed page layout may be more than you may have time to learn. So in some cases, rather than doing a science experiment on this, you are better to be an engineer. If one approach does not work as you expect but another does, just avoid the first approach.
July 2, 2023 at 09:48 am - Permalink