What parameters best characterize a cluster in a 2-D data set?


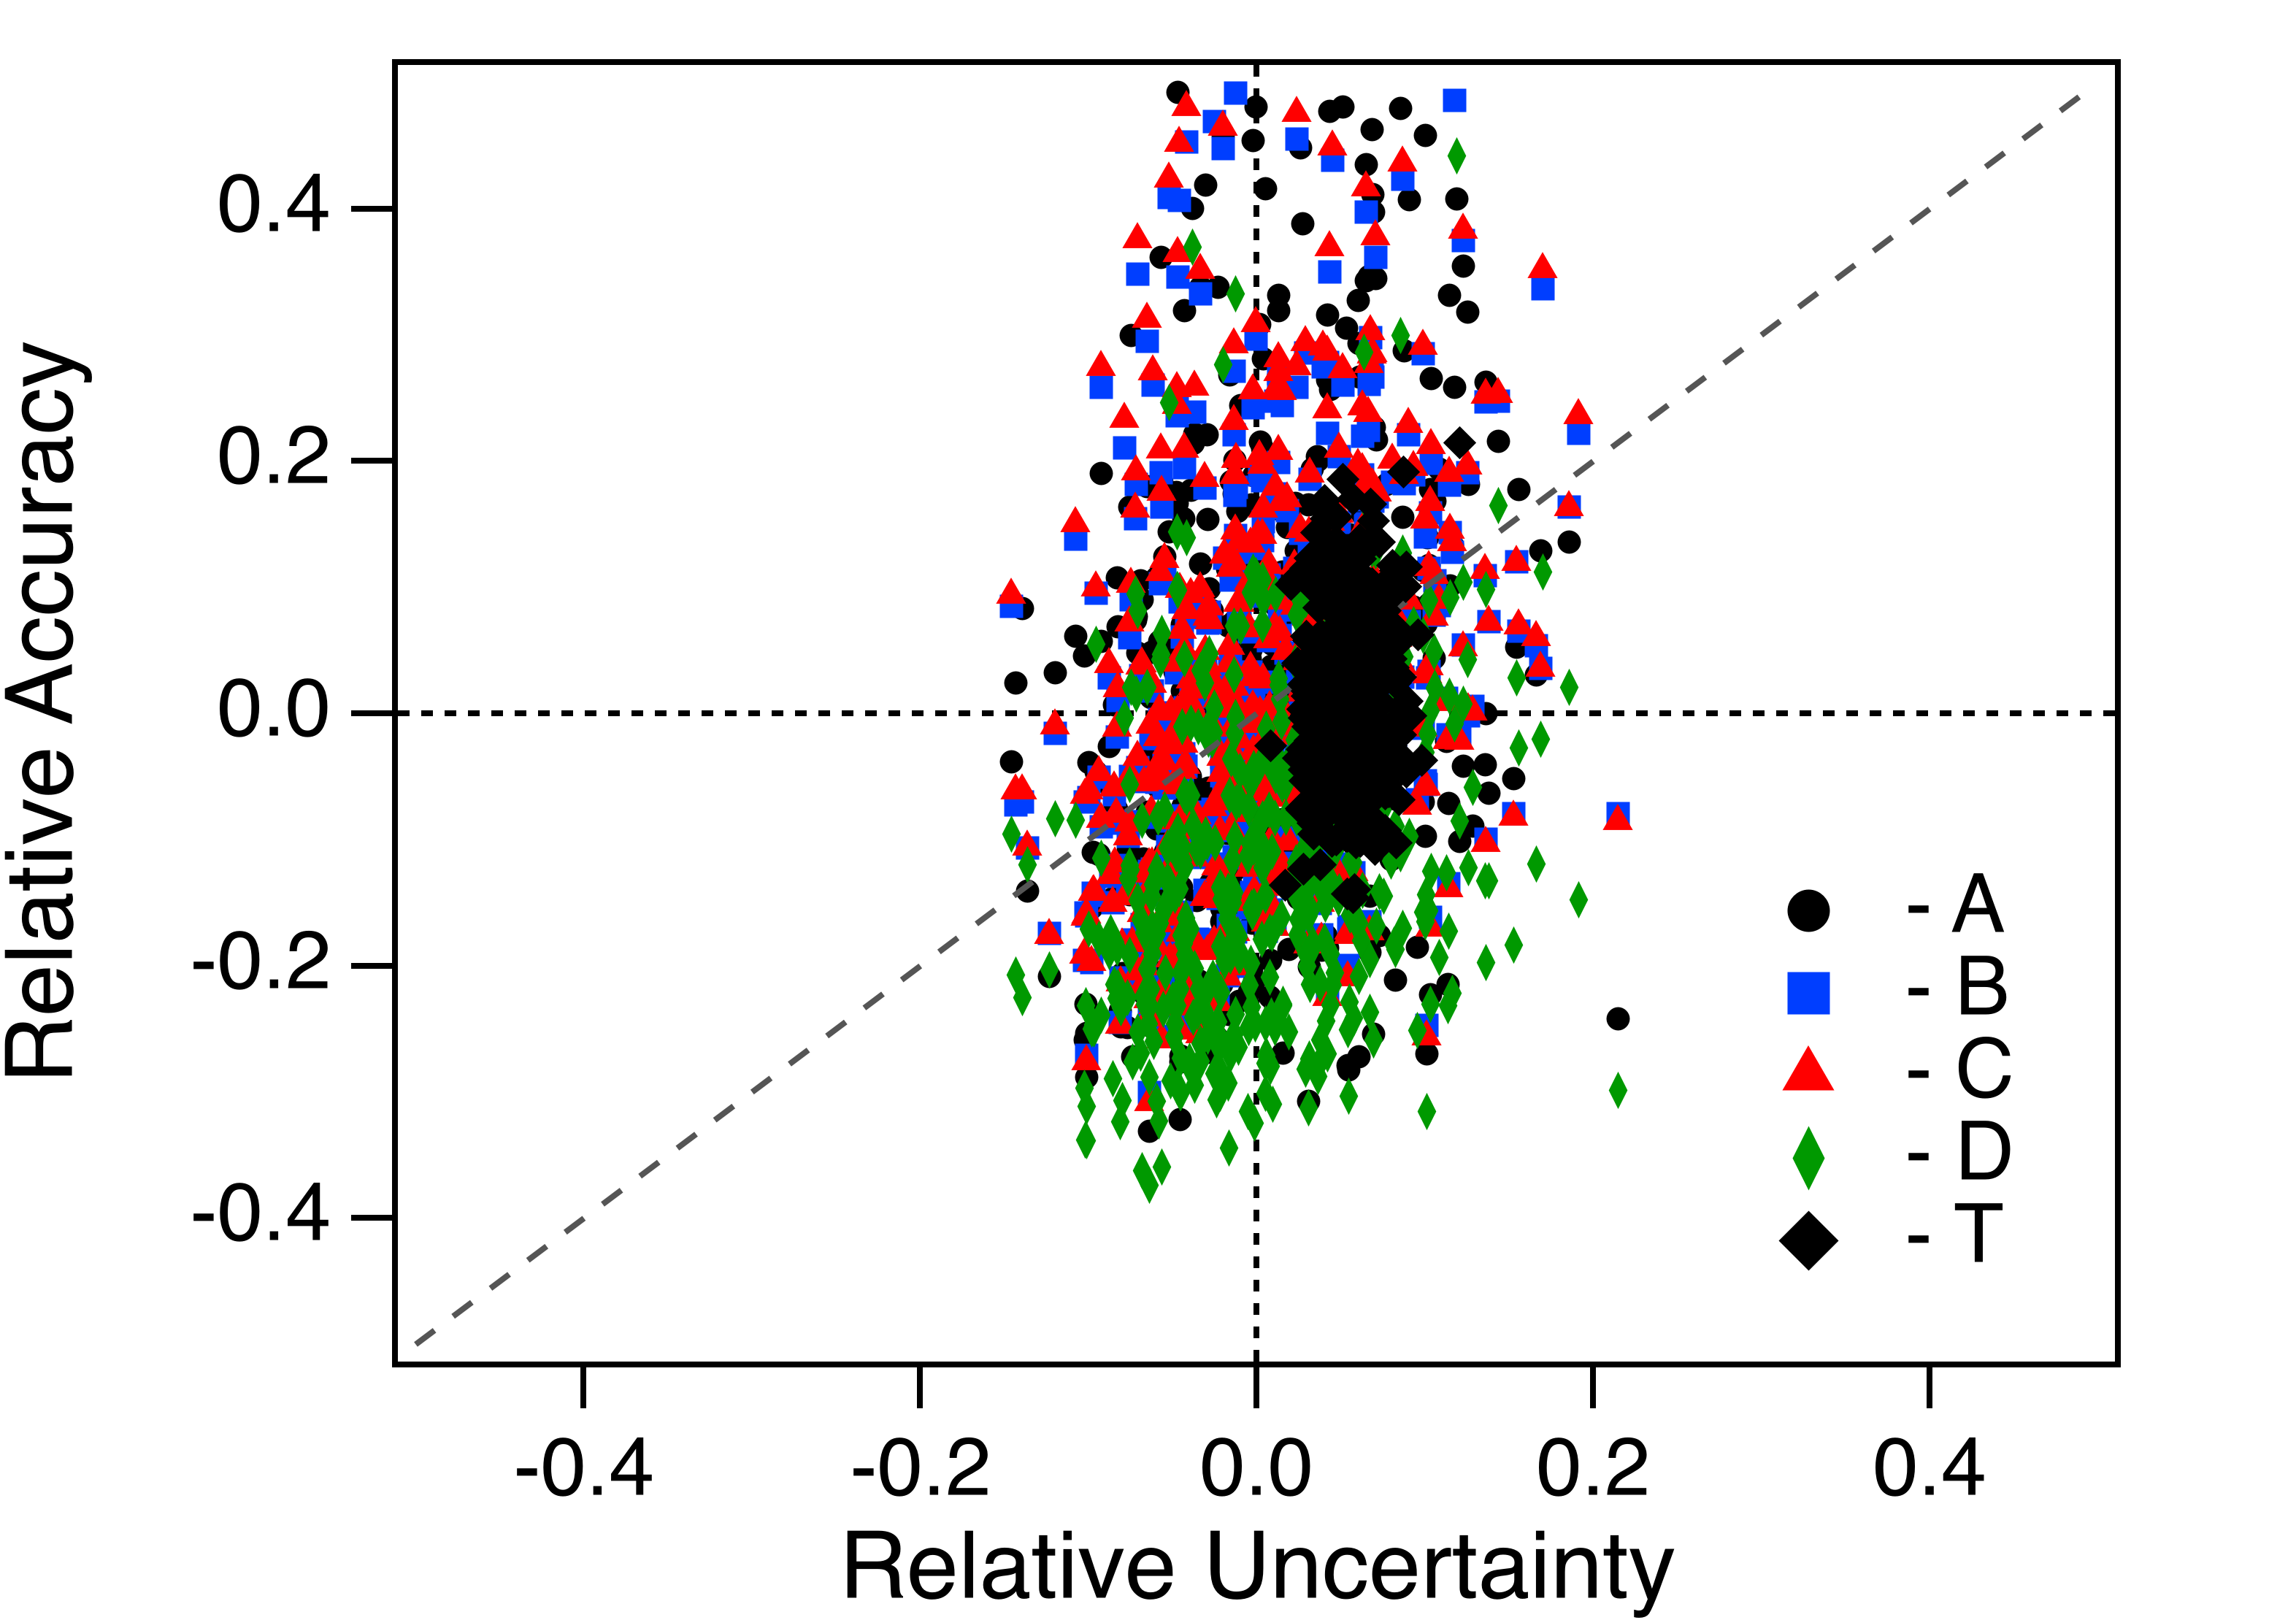
I am comparing output performance on test cases. The two parameters that I track as output performance are relative accuracy RA and relative uncertainty RU. I show an example plot for distributions obtained plotting RA versus RU from 900 samples in each of five different test cases I would like to obtain parametric measures on the distributions to chart the five cases.
The samples are brute force curve fitting to five different equations that should fit a data set. The T form is the non-linear regression fitting. The A - D forms are linearized fitting models. I generate raw theory, add Gaussian noise to the raw data, and perhaps chop out a front end portion of the data as computational ways to mimic experimental approaches to obtain the data. I envision mapping perhaps three parameters for each of the five clusters. I think about this as plotting three characters of a "best fit" ellipse ... centroid (center of mass), aspect, and rotation.
I am hitting the wall of my complete ignorance on the best approach here. Recommendations would be greatly appreciated.
If you use the FPClustering operation you may be able to characterize your clusters using the inter-cluster distances in the wave M_InterClusterDistance.
AG
April 17, 2024 at 03:33 pm - Permalink
Thanks AG. I found in the meantime that my data was incorrect. I was using the wrong index from a multi-dimensional matrix. A correct representation is below. I have decided simply to extract averages and standard uncertainties in the two coordinate frames (relative accuracy and relative uncertainty) as metrics from each distribution. I can plot those as a function of my input control parameters.
May 3, 2024 at 06:20 pm - Permalink