


Get to Know a Feature: The Debugger
Created on September 16 at 11:57 am - by: admin
Igor’s Debugger has been improved in Igor Pro 7; take a look at the main improvements:
- WAVEs in a "Real" Table
- STRUCTs in the Variables list
- Long Strings Inspector
- New "Error on this Line" Indicator
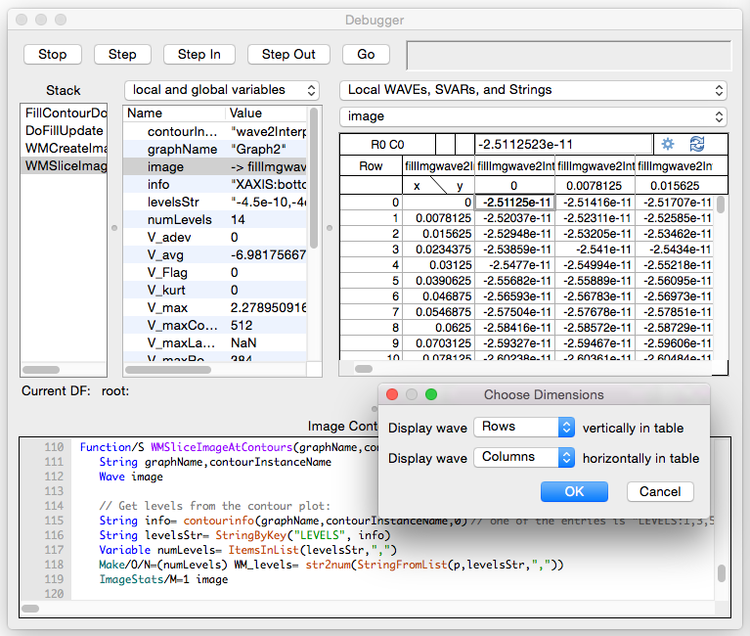
WAVES IN A "REAL" TABLE
Igor 6 displayed wave values in a single-dimension "slice" through the wave, which was clumsy for multi-dimensional waves such as image matrices. The Igor 7 table "inspector" now shows all elements of any two dimensions just like a regular Igor table, and you can even edit wave values.
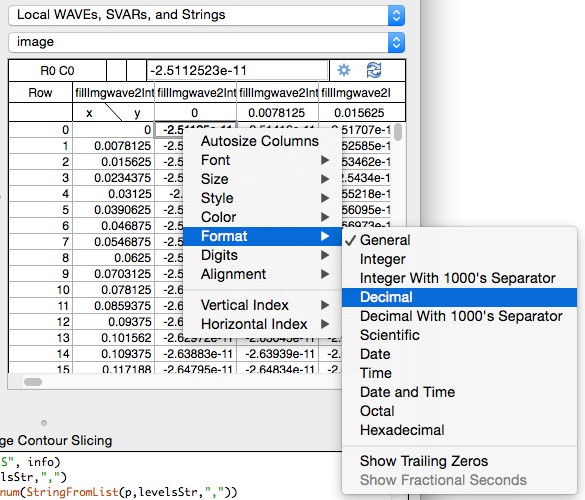
Many of the standard Table menu choices are available from a contextual menu:
STRUCTS IN THE VARIABLES LIST
In Igor 7, the elements of a Structure are displayed in tree form in the Variables "list". Click the triangles to expand or collapse a node in the structure, or double-click the row:
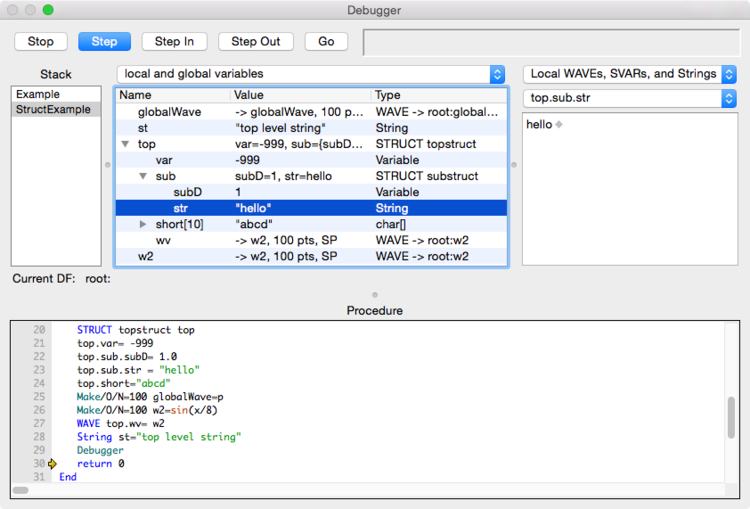
The row shows a summary of the elements in the structure, and isn't editable.
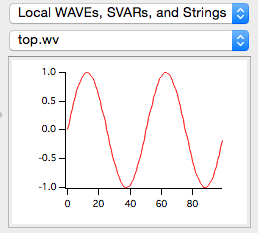
The individual elements in the structure are editable by double-clicking the value and typing in the new value. Double-clicking a WAVE reference in the structure shows the wave values in the table or graph inspector.
Double-clicking a String element or char array (such as top.short) will send it to the new Long String Inspector.
LONG STRINGS INSPECTOR
Igor 7 adds the ability to view and edit strings longer than 255 characters in the new "String Inspector". Select a String or char array to be inspected by two methods:
- Choose "Local WAVEs, SVARs, and Strings", and then choose a String, SVAR or char array from among the objects listed.
- Double-click any String, SVAR or char array in the Variables list.
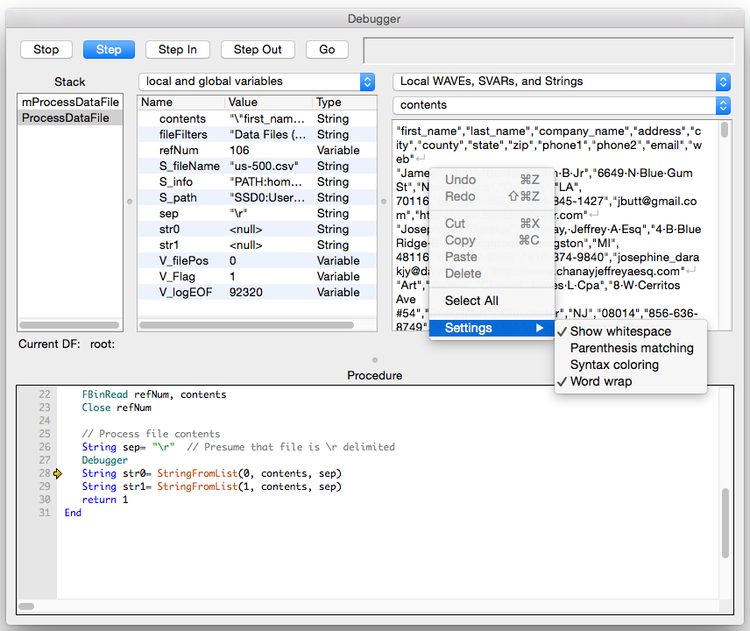
The option to show or hide whitespace indications is in the contextual menu's Settings submenu.
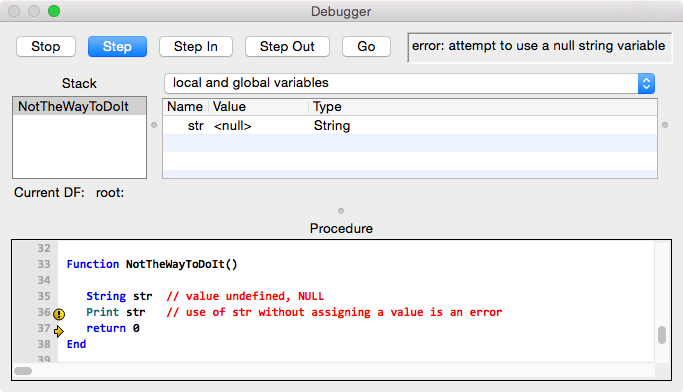
NEW "ERROR ON THIS LINE" INDICATOR
The "Debug on Error" feature is helpful for identifying where a runtime error occurs.
However, Igor 6 just stopped and showed the current program pointer (yellow arrow icon), which pointed to the command after the line that produced the error.
Igor 7 now helpfully shows the actual line that generated the first encountered error using a round yellow exclamation icon.
OTHER DEBUGGER FEATURES
Double-clicking a column title in Variables List header auto-sizes that column to fit the contents.
Pretty much unchanged from Igor 6, but very useful is the Expressions inspector. Enter any expression involving variable names and builtin-functions to get a calculated result. It's useful if you want to step through code while observing wave0[999], or compute some simple metric using built-in functions such as sum(wave0).

Forum

Support

Gallery
Igor Pro 10
Learn More
Igor XOP Toolkit
Learn More
Igor NIDAQ Tools MX
Learn More