Image as a background corresponding to a ScatterPlot


Dear all,
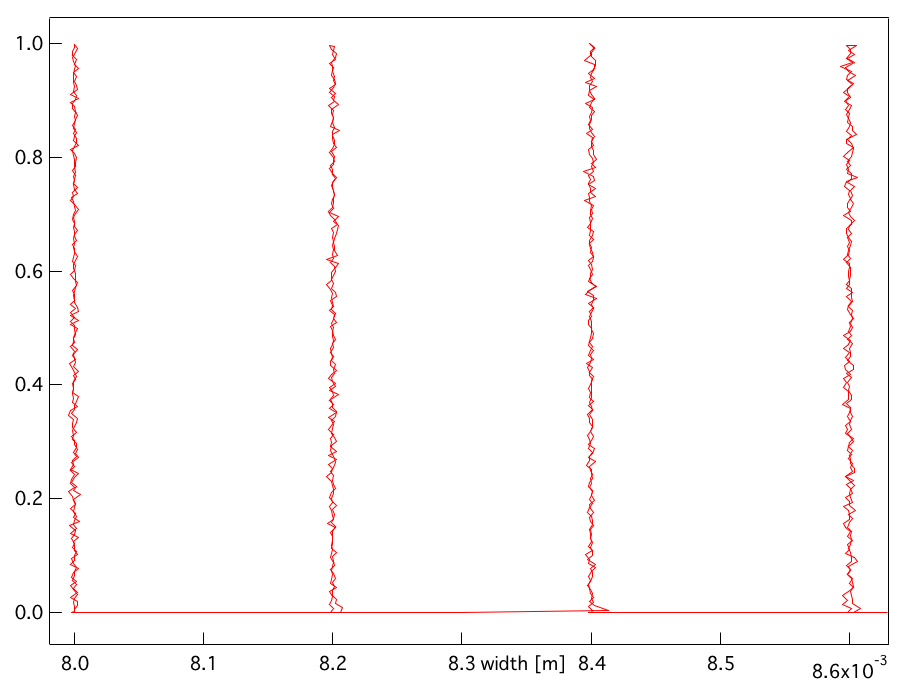
I'm new to IgorPro. I collected data from a map as a scatter plot (attached) now I want to add an image of the actual map behind it. What is the best way to do so without loss of scaling information.
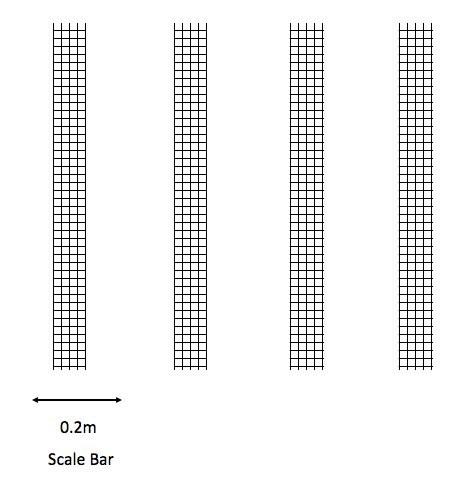
Here map represents the exact location of four patterns in x (width) and y coordinates. The scatter plot represents deviation of laser beam while scanning the area. So I want to show both map and deviation on top of each other, in other words append scatter plot on top of the map image.
Thanks

Forum

Support

Gallery
Igor Pro 10
Learn More
Igor XOP Toolkit
Learn More
Igor NIDAQ Tools MX
Learn More
I take it the grid is the map. If it is in the form of a matrix wave, set the X and Y scaling of the wave to the actual values it represents. Then append the matrix as an image to the same graph as your plot of the laser track.
September 10, 2018 at 03:43 pm - Permalink
I would also like to add that if you append an Igor experiment file, you may get some practical help, like a demonstration of what I meant in my previous post.
September 10, 2018 at 03:44 pm - Permalink
If the image is not already in matrix form,the more simple-minded approach for an arbitrary background image is simply to save/convert the image in Igor-compatible format. the LoadPICT operation can accept Enhanced metafile, Windows metafile, DIB, Windows bitmap, PICT, PNG, or Unknown type inputs. Once the image is in 2D matrix form, then
Then any standard form of wave trace (including a scatter plot) can be added on top of the image, as long as the image and trace x- and y- scales overlap.
September 11, 2018 at 06:06 am - Permalink