How to make a X(time-series)Y(depth)Z(Uspeed) plot


Hi
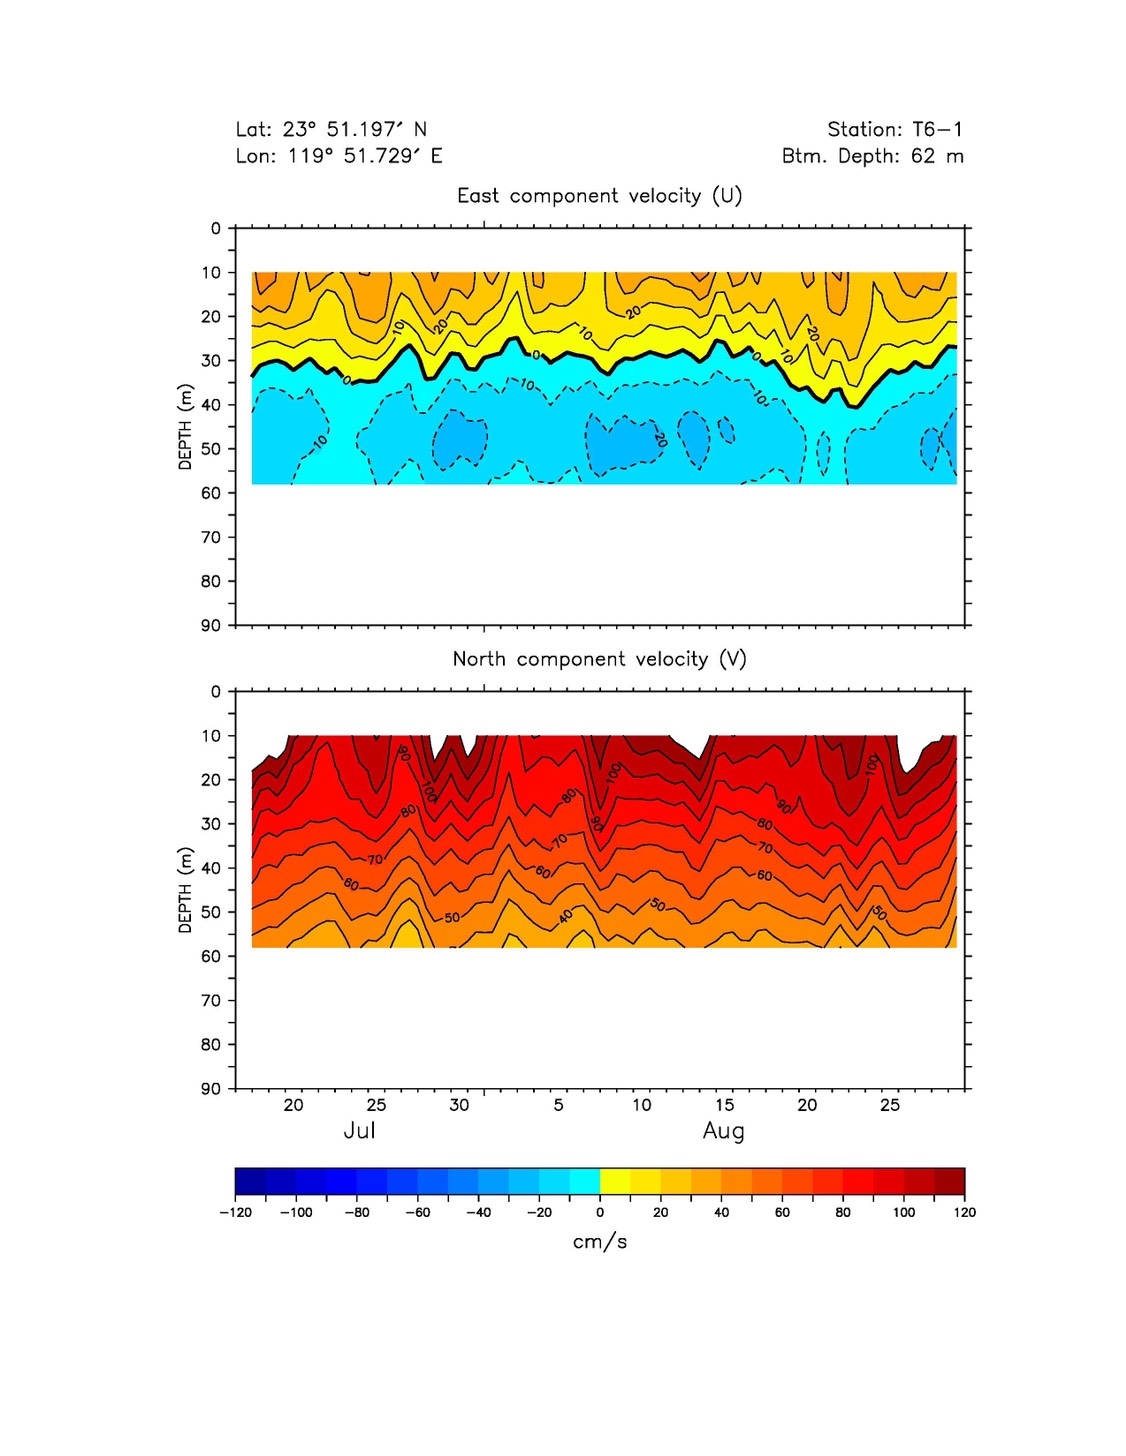
I've try working on making a times-series vs depth vs Uspeed plot as picture attached whole day, I try XYGridandZtomatrix but result didn't seem well, after that I found following code to interpolate, but I can't let my time-series interpolate, can anyone tell me how to make a XYZ plot as picture attached, thank you.
macro test()

killwaves/a/z
killvariables/a/z
killstrings/a/z

Make/O/N=20 xWave=enoise(4),yWave=enoise(5),zWave=enoise(6)  // Random points
Display yWave vs xWave
ModifyGraph mode=3,marker=19
ModifyGraph zColor(yWave)={zWave,*,*,Rainbow,0}

Concatenate/O {xWave,yWave,zWave}, tripletWave
ImageInterpolate/S={-5,0.1,5,-5,0.1,5} voronoi tripletWave
AppendImage M_InterpolatedImage

Forum

Support

Gallery
Igor Pro 10
Learn More
Igor XOP Toolkit
Learn More
Igor NIDAQ Tools MX
Learn More
Your test data is not nearly dense enough to make image and contour plots that look anything like that.
Perhaps you can share your actual data.
These plots are really easy to produce with Igor given the right data.
June 28, 2019 at 09:30 am - Permalink
In reply to Your test data is not nearly… by JimProuty
yt_tsaiFirst, thank you for your reply, I upload my data as attached, I got current profile for 16 layers, every file include 6 variables as following.
I think my data is quite dense to make image and contour, maybe I misunderstand how to make the plot.
1.date/time
2.vector u (eastward current velocity)
3.vector v (northward current velocity)
4.current speed
5.current direction
Sincerely yours
July 2, 2019 at 01:26 am - Permalink
What value do you assign to each layer? is it depth? How is it computed?
July 2, 2019 at 11:10 am - Permalink
Sorry, I forgot to mention where did I mark the depth.
Each file name include depth, I mark it on the attached picture, and every file contain date/time, U, V, speed and direction in time-series. These data were output by observation instrument.
July 2, 2019 at 05:24 pm - Permalink
I looked at this a little bit, and doubt that the noisy data will contour well.
I've attached my attempt to make a graph like you showed using your data, assuming that a file ending with "_004.check" meant it was recording a depth of 4 meters, and _012 was 12 meters.
I think you wanted z = either U or V at various depths (Y) for various times (X).
I loaded each file's contents into a data folder keyed by file name, which I assume corresponds to one depth.
See attachments for experiment and screenshots.
July 2, 2019 at 05:38 pm - Permalink