Demo VLE Diagrams

This package is designed to demonstrate the behavior of vapor-liquid equilibrium (VLE) phase diagrams for binary component solutions. It can be run as an interactive demonstration by instructors or students in physical chemistry or chemical engineering thermodynamic courses that cover the topic of VLE phase diagrams. It can also be used to create specific types of VLE diagrams for course assignments.
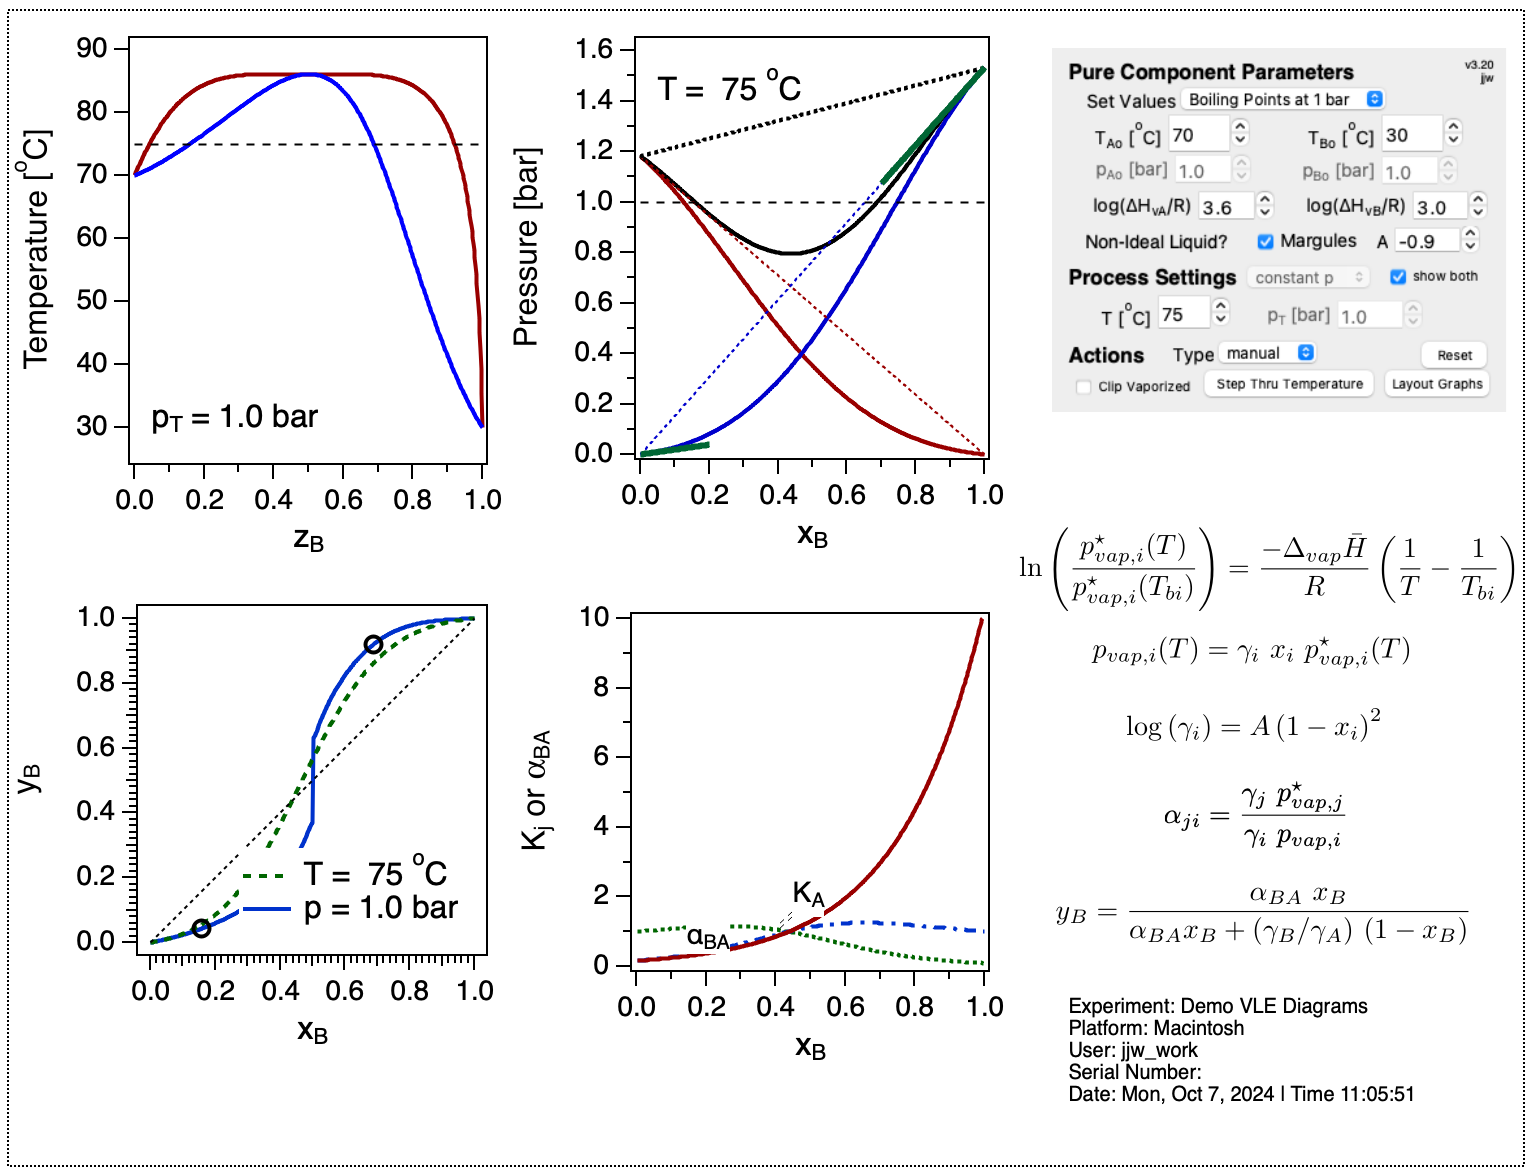
The package shows three phase diagrams: temperature versus composition (T-z), pressure versus composition (p-z), or gas composition versus liquid composition (y-x). A control panel gives options to set parameters for the two components, including boiling points at 1 bar, vapor pressures at 20 oC, vaporization enthalpies, and solution non-ideality defined via a one-parameter Margules equation. The control panel also gives options to set the system temperature and total pressure. The graphs change dynamically as the inputs are changed. At any point, the user can obtain a snapshot layout of the results that includes the three graphs, the fundamental equations used in the calculations, and the input parameters supplied to the control panel.
The release ZIP archive contains the Igor Pro pxp file. A snapshot layout is shown below.
Images:
Project Details
Current Project Release
Demo VLE Diagrams 3.20
| Release File: | Demo VLE Diagrams v3.20.zip (256.65 KB) |
| Version Date: | |
| Version Major: | 3 |
| Version Patch Level: | 20 |
| OS Compatibility: | Windows Mac-Intel |
| Release Notes: |
Changes
|

Forum

Support

Gallery
Igor Pro 10
Learn More
Igor XOP Toolkit
Learn More
Igor NIDAQ Tools MX
Learn More