Significant digits in Multipeaks fit parameters


Hi,
My question is related to a similar one posted in this forum over 10 years ago... in fact it is basically the same question, applied to a different Igor package:
https://www.wavemetrics.com/forum/general/changing-number-significant-d…
I am testing Igor Pro, and more specifically the "Multipeak Fitting" feature, to fit a number of peaks in a spectrum. In the example I am using they are well isolated from each other and can be fitted with Voigt profiles without a problem in a matter of seconds (or less) with an adequate initial guess. The problem I am finding is that when I check the parameters in the report the peak positions are given with less significant digits than I require.
Please notice that these spectra are obtained with a high resolution technique. A typical frequency (wavenumber, really) for one of my peaks can be 16500.123 cm-1 (and yes, I can reliably measure wavenumbers to 10-3 cm-1 and better), so typically I like to work with at least 4 decimal digits and round everything up later if needed.
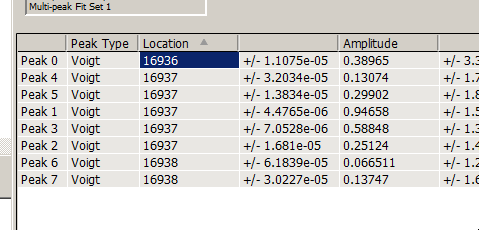
In the "Multipeak Fit 2 Results" window I am presented with after the fit I can see the parameters for each peak, and to my surprise the frequencies are given with no decimal digits: 16936 cm-1 in the case I am looking at right now. The standard deviation associated to that number as given by Igor is, however, of the order of 1E-5 cm-1... which sounds about right, but makes it obvious that more decimal digits need to be given in the main figure. The same happens to every peak in the spectrum (I have eight peaks in this example). I have results like 16937+-0.00001 cm-1. See the attached figure that illustrates this.
I have looked at the outputs generated when the table above is exported to a notepad or to a tab-delimited list, with the same result.
I have looked for the W_coef wave, as indicated in the post above, but there isn't one by that name. There are, however, many waves created during the fit, some of them specific for each peak, and some of these seem to contain the frequencies I am looking for (at least the frequencies, because other parameters that appear there don't match the ones presented in the results window; it might be because of the Voigt profile and the results window presenting different parameters from the ones the profile depends on "directly"), but it is rater inconvenient to have to open one wave for each one of the peaks that have been fitted, reformat the wave to show the decimal digits, etc... Is there a more direct approach to obtaining these numbers without having to "hunt" them one by one?
Also, is there a way to do a similar thing with the bottom axis (force a non-exponential format with a given number of decimal digits for the labels)?
Thanks in advance!

Forum

Support

Gallery
Igor Pro 10
Learn More
Igor XOP Toolkit
Learn More
Igor NIDAQ Tools MX
Learn More
Please send a message to support@wavemetrics.com about this. I have just modified the Multipeak Fit code to try to estimate the number of digits that should be shown in the results panel and the results notebook. I would be happy if you would try it out.
And for the graph- it is just an Igor graph, so you can modify in standard ways. For what you want, double-click the axis to bring up the Modify Axis Dialog. Select the Ticks and Grids tab. As appropriate, set the High Trip (Low Trip) value to a higher (lower) number.
February 20, 2020 at 12:12 pm - Permalink
I think you correctly found the coefficient waves for the fits. Each peak has it's own coefficient wave, which is good for some things and bad for others. The waves with names like "Peak 0 Coefs" are the basic fit coefficient waves. The derived parameters reported in the Results panel are computed after the fact and are not reflected in waves in that folder.
February 20, 2020 at 12:16 pm - Permalink
Thanks for the reply, and for adressing this so quickly! I have just sent a message to support as suggested.
February 20, 2020 at 11:10 pm - Permalink
I might suggest an approach to address this problem during the peak fitting with the current version of the package:
* Subtract an offset from the x-axis scaling of the data. In this case, perhaps 16935.
* Multiply the x-axis scaling by a factor of 1000.
Presuming that you know the xleft and dx of your wave called dwave (and presuming the scale is linear):
Now all the scales run with digits in the range of the uncertainty that you have
To obtain back the true peak positions and uncertainties from the fit coefficients, reverse the above steps.
February 21, 2020 at 06:21 am - Permalink
jjweimer's suggestion may also enhance numerical stability.
February 24, 2020 at 01:27 pm - Permalink