Interactive 2D wave Displayer
For What?
-
Display and Paper-figure-quality format of an 2D wave, with efficient color type and scale control.
-
It is a sophisticated replacement for a simple Igor command combination,
Display; appendimage myTopograph
*** Notes
- In this package, the X and Y ratio was set to Plan. This is mostly suitable for an image with its X and Y scales belong to same physical quantity, e.g. a real space 2D map.
- After the Image automatically show and format, there are several control items which enable quick manipulation of color display.
How to Call the Function
- We defined an Operation Function, a Button Control Function, and a Wave Name Grabbing Function, as listed below in sequence.
//Please check the Codes in .ipf files, Here we only show the structure
Function d(name) //Operation Function
    wave name
    //<body and called functions>
End

Function ButtonProc_Showfigind(ctrlName) : ButtonControl //Button Control
    String ctrlName
    d($tpw())
End

Function/S tpw() //Wave name Grabbing Function
    String name
    getwindow $winname(0,1) activeSW;
    name = stringfromlist(0,WaveList("*", ";","WIN:"+S_Value))
    Return name
end
- Method #1: Typing d(name) in command line, note that the name is a wave, not a string.
-
d(myTopograph) - Method #2: Create a Button control on a user-defined Panel, and call d(name). Here is an advanced application owing to the merit of Function tpw(). If you are handling a complex graph with multiple subwindows, the tpw() can know whether you select a specific subwindow or the main window, then read out the name of the corresponding wave on the top layer of the sub/main window. By the clicking the button, you can easily display a formatted individual image from a complex window, by selecting a specific subwindow of interest.
List of Properties
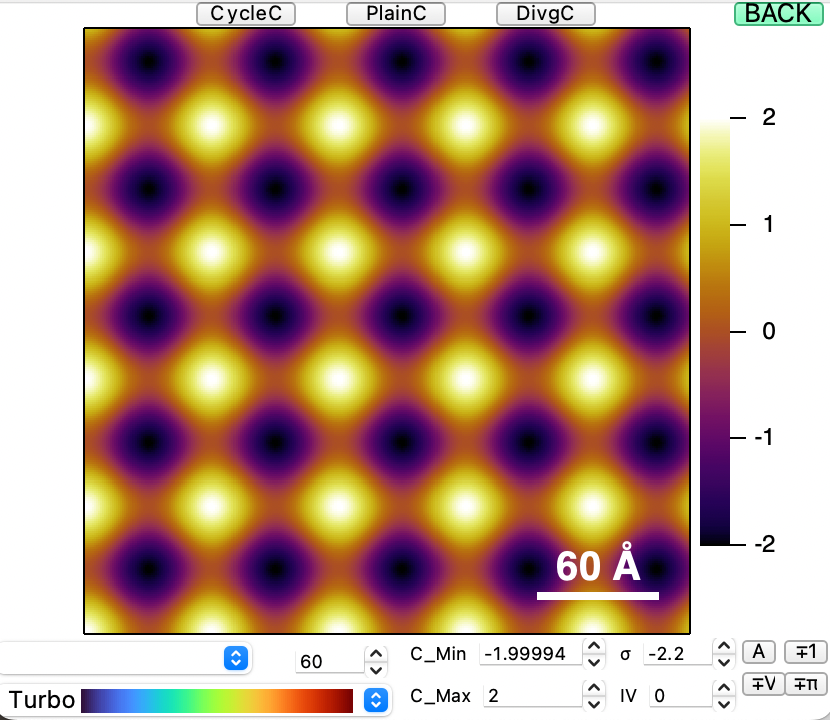
- The graph of 2D wave will be automatically formatted.
- The scale bar will be automatically calculated, assuming the unit is Å.
- Multiple control items will be created simultaneously.
- At the top-Middle, the three Buttons can change different color styles, among cyclic, linear and diverging color styles.
- At the top-right, there is a button to close the window.
- At the bottom, you can change to any kinds of color table by the popupmenu. You can also vary the color table very efficiently by control the setvariable control by your keyboard.
- C_min and C_max set the lower and upper bound of color range.
- σ set the color range to n*σ.
- IV is the color inverse.
- Four small buttons at the right-bottom are different types of color range, "A" stands for auto range {*,*}, "±1" tunes {-1,1}, "±π" tunes {-π,π} and "±V" turns {-{|V_min|,|V_max|}max,{|V_min|,|V_max|}max}
Users Extension
- User-defined Color Table is possible.
- Here is another Popupmenu at left-bottom should look like blank when you first launch the Function, this is the control of user-defined color table, of which the file should be put in the datafolder root:Packages:NewColortable: you can introduce your own color table on that Datafolder, and using them as the same manner of built-ins.
Potential compatible modifications needed
- Aspect ratio and Figure size, position of controls
- you can change it easily from the body of Function d(name)
Images:
Project Details
Current Project Release
| Release File: | Interactive2DwaveDisplay.ipf (13.6 KB) |
| Version Date: | |
| OS Compatibility: | Mac-Intel |
| Release Notes: |
This function is part of the Kong Panel, an Igor Pro package developed by the author for processing STM data and performing simple model calculations. |

Forum

Support

Gallery
Igor Pro 10
Learn More
Igor XOP Toolkit
Learn More
Igor NIDAQ Tools MX
Learn More