SpXZeigR - Graphing for Chemical Spectroscopies

Background
I am redeveloping this package as an efficient way to display data from chemical spectroscopies. My intent is to provide ease of use for basic users to do basic things in order to produce a publication-ready graph. I try to use sparse panel designs with intuitive selection options. I provide methods to set up one-choice-makes-it-all-happen graphical designs through easy-to-understand (YAML) format files. Where possible, I also include links to other packages that can provide advanced features (e.g. baseline fitting or spectral peak fitting).
Overview
Here is a representative picture of the appearance for many of the features in SpXZeigR.
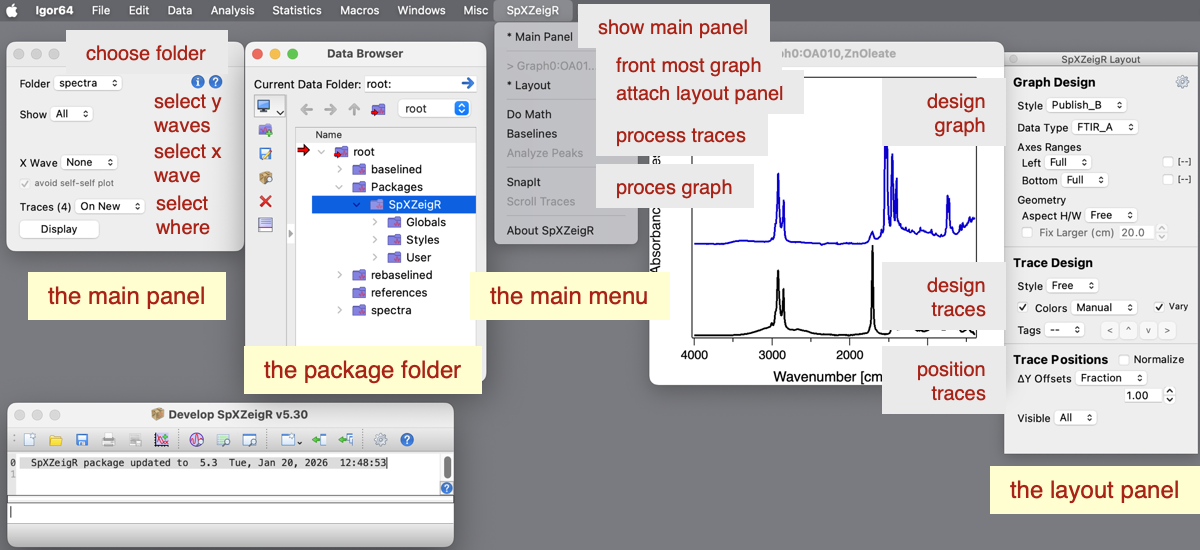
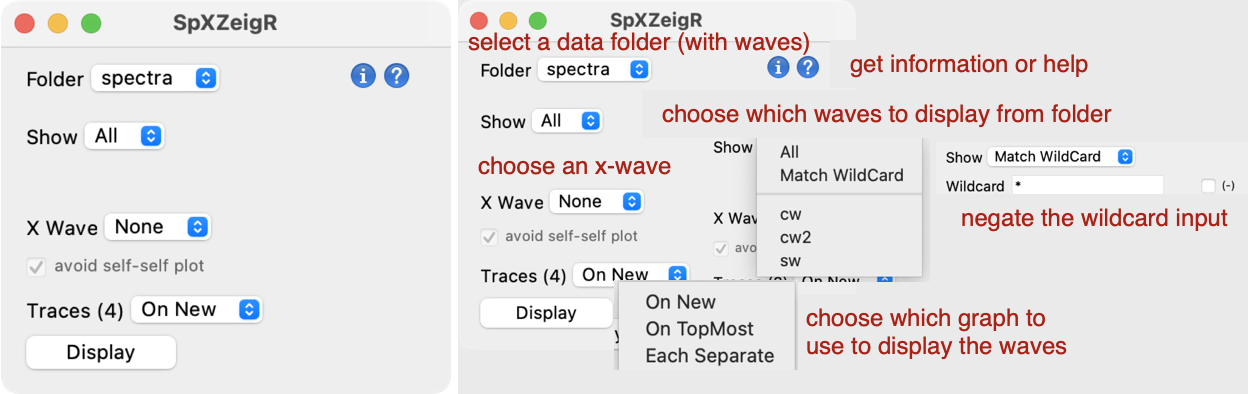
The Main Panel (far left) allows you to choose which folder and which data waves (y and x) to display. It allows you to choose where to display the data waves. When you click the Display button, a graph is created and a Layout Panel is attached to it.
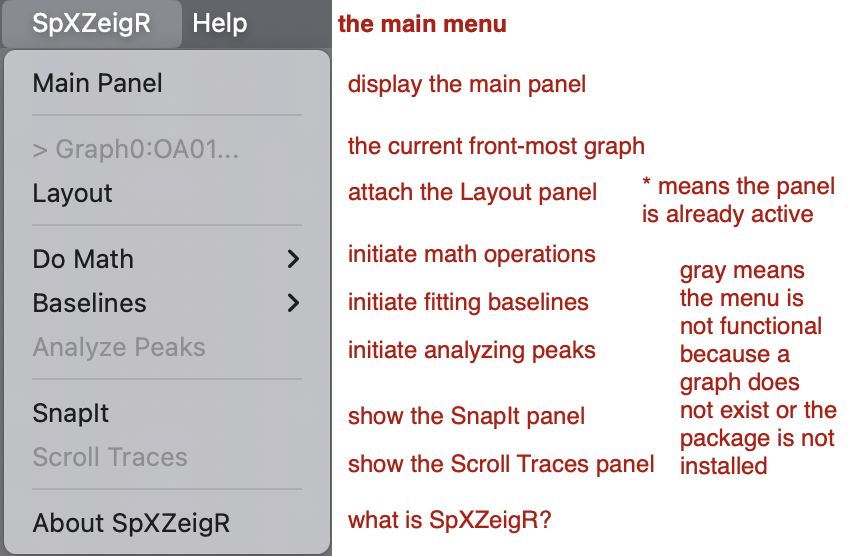
The SpXZeigR Menu (middle) provides options to show the Main Panel, attach a Layout Panel to an existing graph, do processing of traces in an already existing graph, or manipulate traces in an already existing graph. Some of these options require that you have loaded other packages. For example, Fitting Baselines (as a sub-menu) requires that you have installed and loaded the Baselines Fitting Package, and capturing graphs as stand-alone experiments requires the SnapIt! Package.
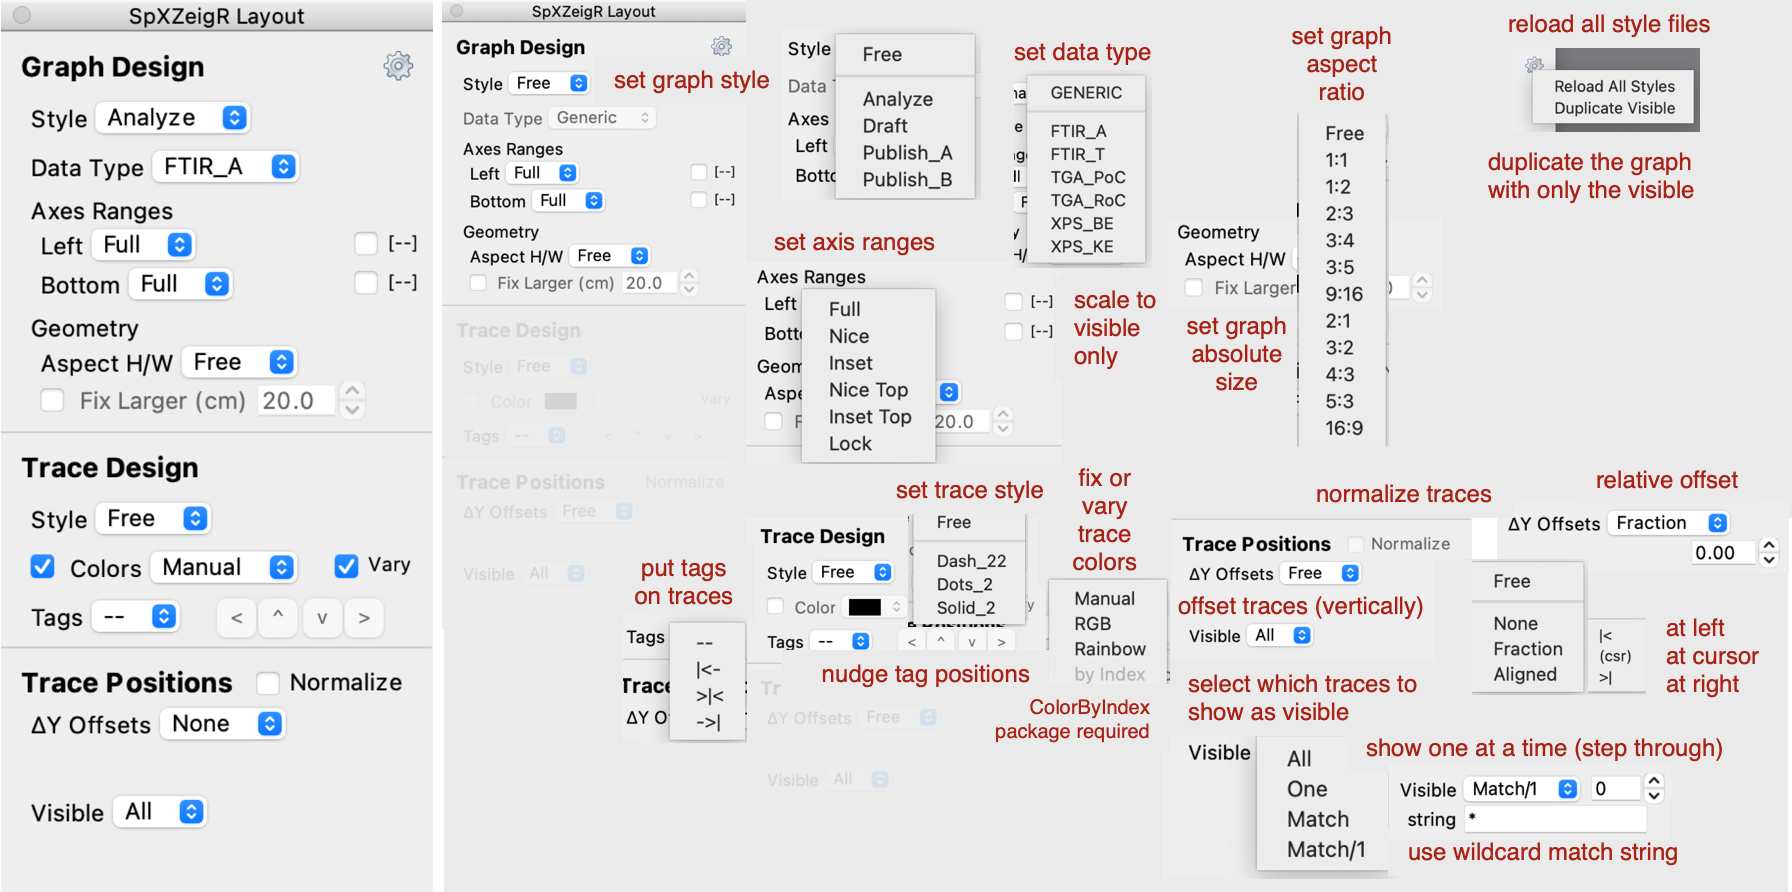
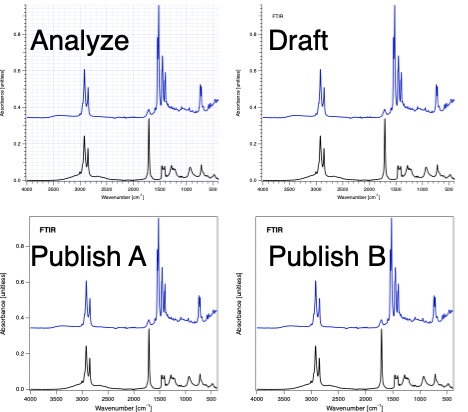
The Layout Panel (far right) is attached to all new graphs created from the Main Panel. You can also attach the Layout Panel to an existing graph. The first layout of a graph is its spectra type (e.g. FTIR, XPS, NMR, ...). The Graph Design section determines such things as the size of fonts, the axes labels, and whether the graph shows grid lines. Built-in graph styles are Analyze, Draft, Publish A, and Publish B. You can set the aspect ratio on the graph and fix the larger size to a defined value. The axes layout primarily defines the range of the left or bottom scale. The Trace Design section allows you to set the style as dotted, dashed, solid, or others as well as to color the traces in a fixed color or by using a color scale (extra options appear with the Color Traces by Index Package installed. You can tag the traces with their (wave) names and offset or align the traces in the graph. Finally, the Trace Position section allows you to manipulate where traces are placed on the graph as well as to select what traces are visible.
Descriptions
I show examples below with descriptions for the options in the Main Panel, Menu Selections, and Layout Panel.
Package Contents
The ZIP archive contains the procedure files and an example experiment.
Help, Suggestions, and Future Development
Contact me for help, suggestions, and information about plans for further development.
Images:


Project Details
Current Project Release
v5.30
| Release File: | SpXZeigR v5.30.zip (40.29 KB) |
| Version: | v5.30 |
| Version Date: | |
| Version Major: | 5 |
| Version Patch Level: | 30 |
| OS Compatibility: | Windows Mac-Intel |
| Release Notes: |
Squashed Bugs ● check boxes to scale to visible only now work properly Improved Code ● moved main panel code to main panel procedure + renamed procedure Improved / Changed UI ● removed tab icon from main panel Added Features ● added 1:2 and 2:1 aspect ratio choices for graph sizing |

Forum

Support

Gallery
Igor Pro 10
Learn More
Igor XOP Toolkit
Learn More
Igor NIDAQ Tools MX
Learn More