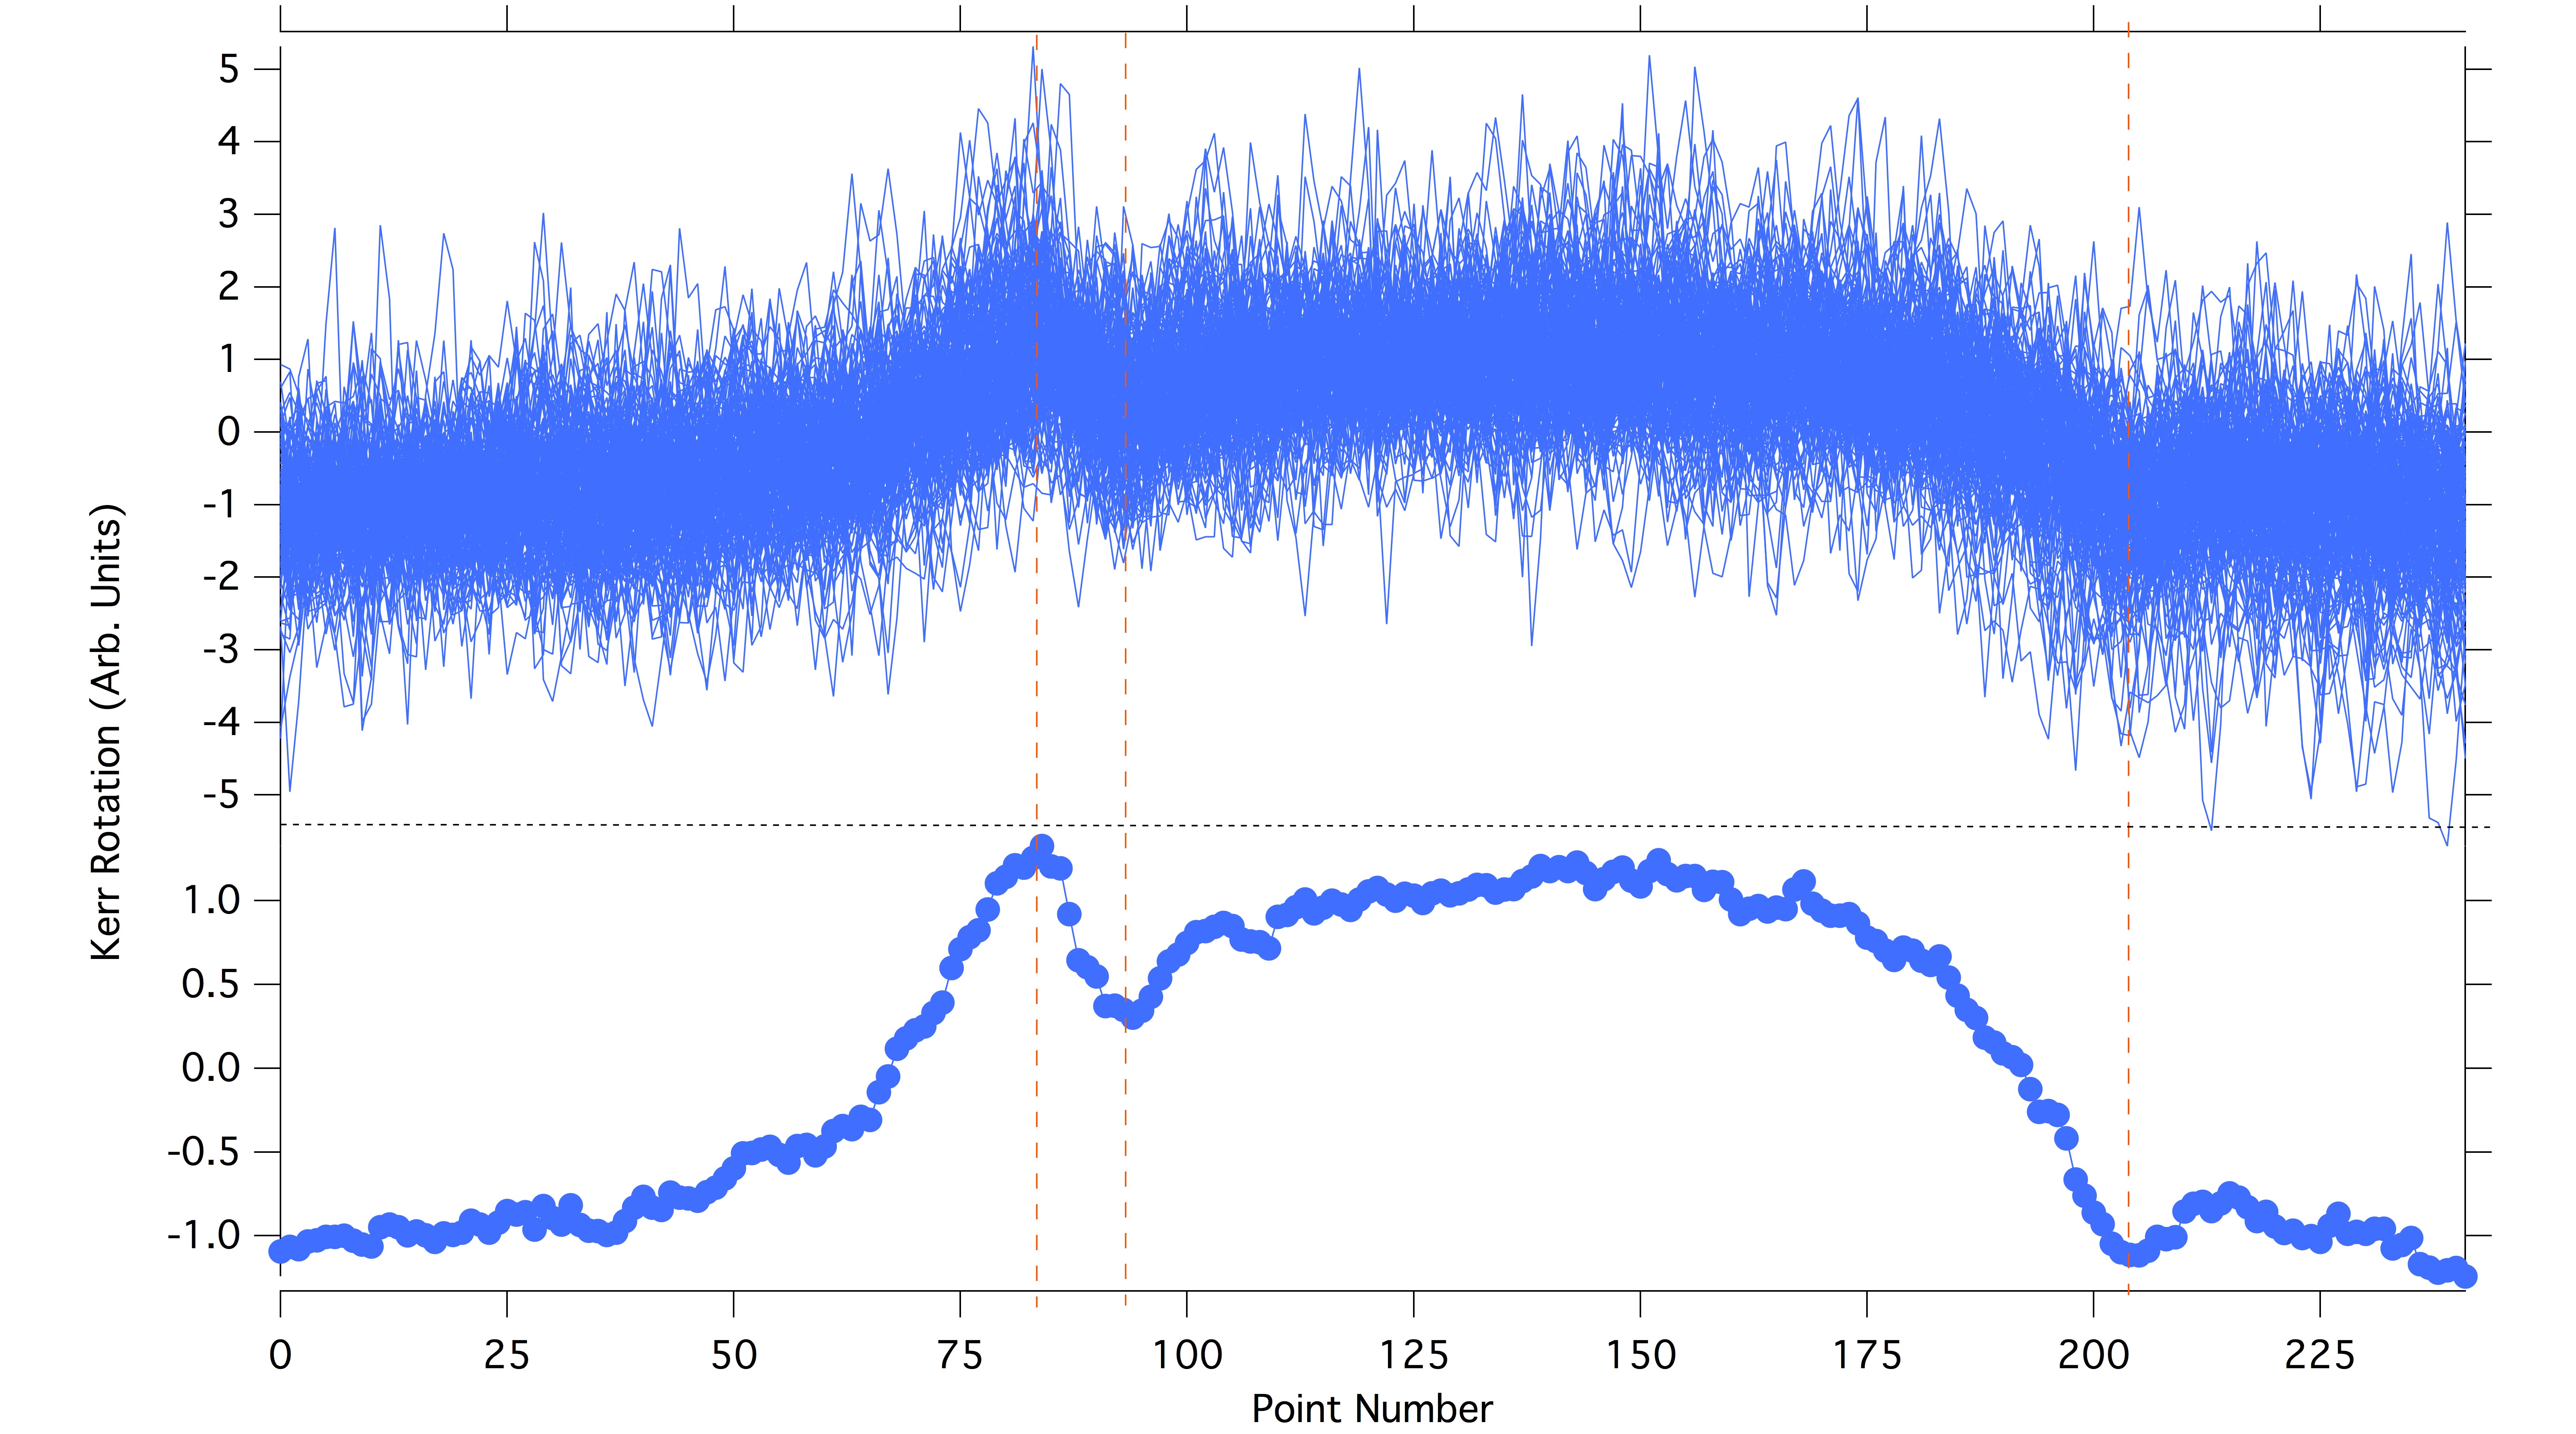
Plotting reversing axis as non-reversing?


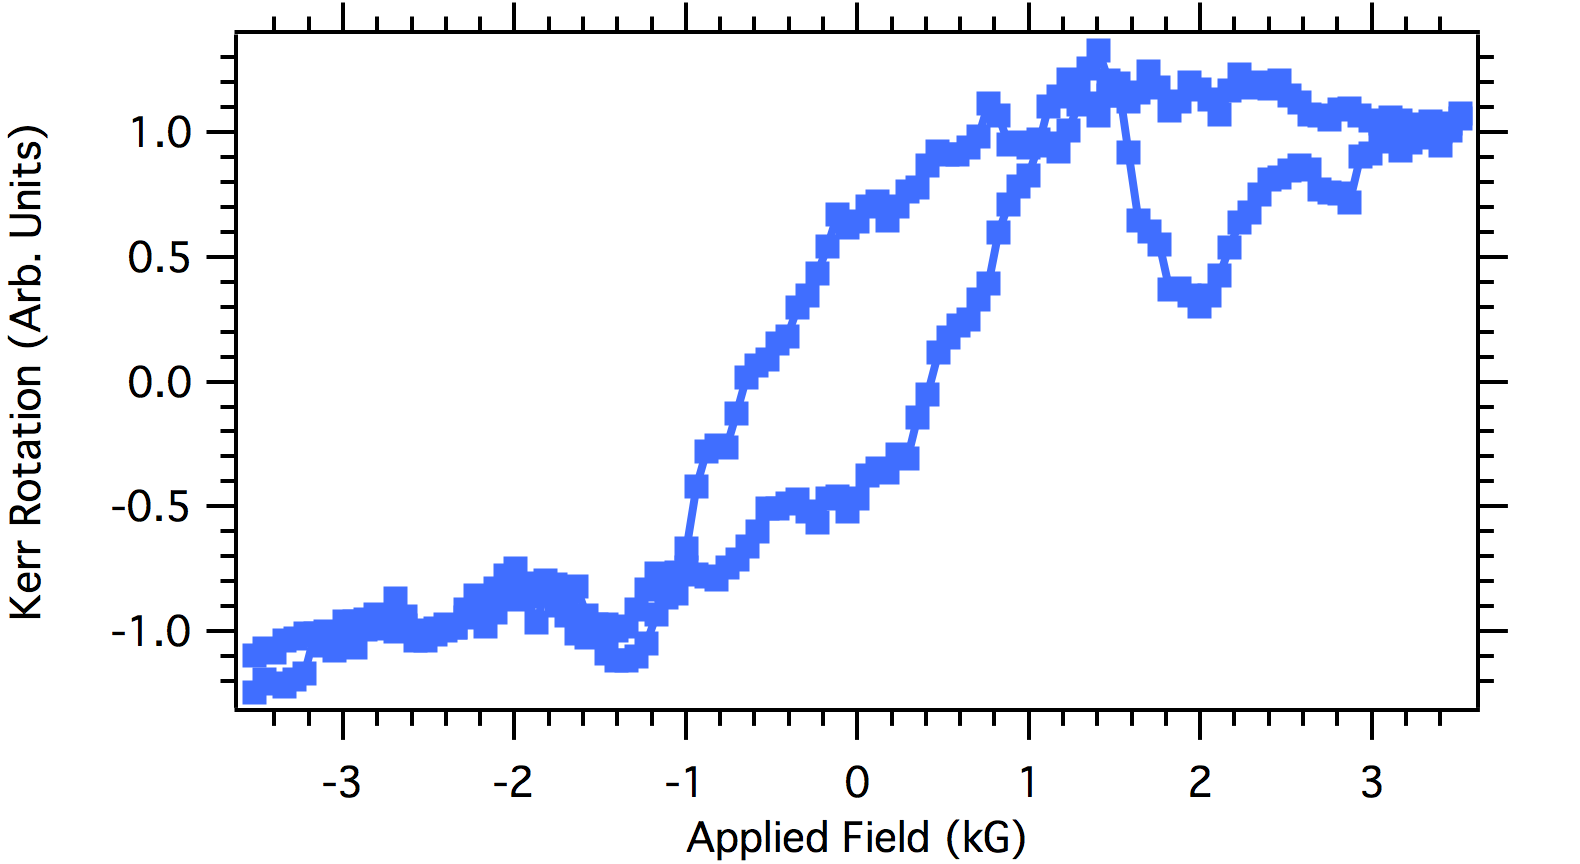
When I plot it vs a reversing field value (-x..x,x..-x) it looks like the second attachment.
Is there a way, without chopping moving and general frustrations to plot a graph that looks like the first image, but the x axis starts at -x, goes to +x, then continues to -x as you move from left to right?
One way to do this:
1. Plot the first subset of data as x (the rising portion)
2. Plot the second subset (declining portion) as x BUT on a new bottom axis.
3. Set the span of the first axis to be 0% to 50%
4. Set the second bottom axis to be50% to 100%
5. Reverse the direction of the second bottom axis
Andy
May 2, 2018 at 04:54 pm - Permalink
May 2, 2018 at 07:53 pm - Permalink
Another option is to create a custom axis ticks and labels. You need to create two waves one with the x locations and the other with text at that location.
If you a running these tests often with the same x values, then it may be worthwhile to make these waves once and just reuse them. If they x values change every time this solution may be cumbersome.
Andy
May 3, 2018 at 07:11 am - Permalink
May 3, 2018 at 09:13 am - Permalink