Why does the profile width parameter of Line Profile (Image menu) not work properly for small-step-value images?


Hi,
I am using the Line profile function to analyze an 2D image spectrum. It is found that the profile width parameter doesn't function properly, which only works for numbers larger than 1, or only updates when the profile width increases by integer numbers.
For example, the X coordinate of my 2D image starts from 0 with a step of 10E-9 (nanosecond) for 5000 points (picture below). I changed the profile width to integrate an stripe area. But the profile never updated, but always showed the profile with 0 width.
Furthermore, another problem is that I can not directly type numbers in the profile center and profile width, when the numbers are smaller than 1. I have to use the up/down increasement buttons to change the value.
Above problems happen on both IgorPro7 and 8. The operation system of my laptop is windows 10 with the latest update.
Cheers,
Y
If you hover over the width parameter you should get a tooltip with the following text:
When width is set to zero the profile is computed by sampling and interpolating along the designated path. When width>0 the resulting profile contains an average of profile values sampled at the center of the path and points up to width distance perpendicular to the path in the same units as the image wave. The actual number of sampling points is 1+2*width/DimDelta. Note that the graphical indication of width may be inaccurate if the image is displayed vs auxiliary waves. Some caution should be used when interpreting width in freehand modes with data that has non-square pixels.
Also, the documentation for the width parameter in the underlying ImageLineProfile operation says:
width=value Specifies the width (diameter) in pixels (does not have to be an integer value) in a direction perpendicular to the path over which the data is interpolated and averaged for each path point. If you do not specify width or use width=0, only the interpolated value at the path point is used.
I hope this helps,
A.G.
November 19, 2020 at 06:43 am - Permalink
In reply to If you hover over the width… by Igor
yu.zhangHi,
Thank you very much for the quick reply. But I am more confused after reading the tooltip and the cited documentation.
My question is exactly about the term "1+2*width/DimDelta" in the tooltip, which doesn't work properly as it says.
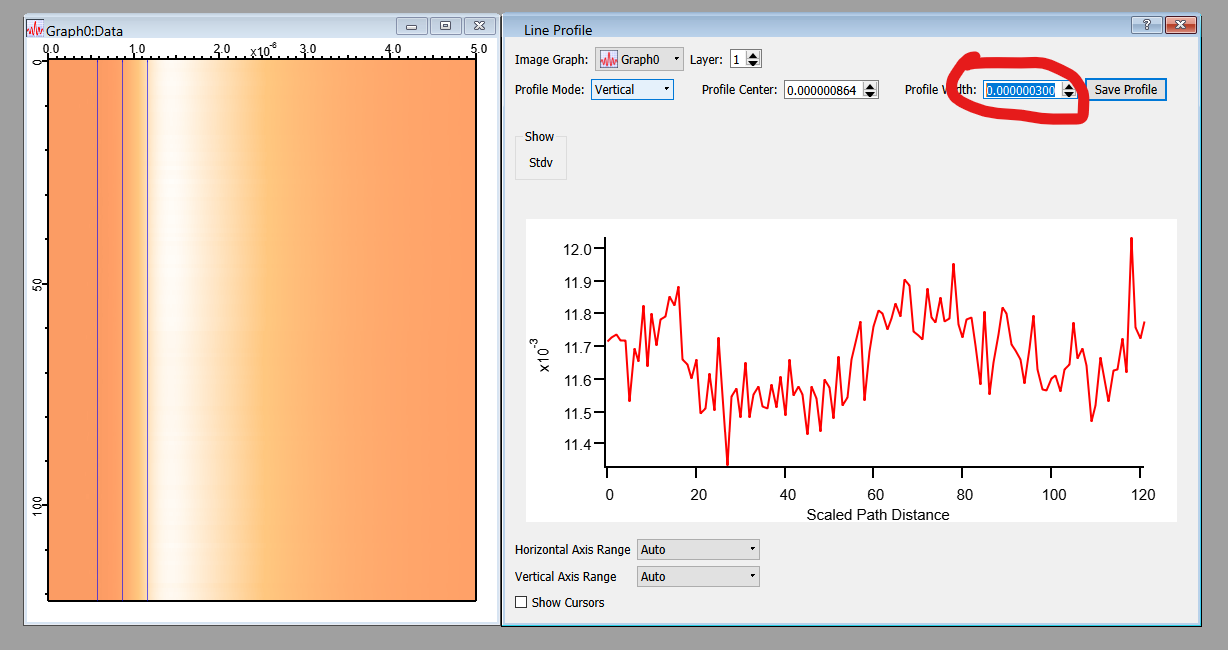
Please refer to the screen shot below. In this example, I set the width=2E-7 and DimDelta=1E-9 (x dimension). With this, I expect a total sampling points of 401, according to (1+2*width/DimDelta). However, the profile curve is only a single pixel profile, not a 401 pixel wide profile. The 401 pixel profile should look like the blue curve shown in the graph.
This happens when the DimDelta is set to some value smaller than 1. In above example, it is 1E-9. When I set the DimDelta to 1 the profile width works fine.
November 19, 2020 at 11:06 am - Permalink
In reply to Hi, Thank you very much for… by yu.zhang
IgorAs you have seen, ImageLineProfile and the corresponding dialog work best with integer pixels. The ImageLineProfile operation uses integer width parameter. The dialog has to convert the "Profile Width" value into an integer width for use with the dialog which it computes by dividing the dialog's Profile Width by the respective dimension's delta as indicated in the tooltip. I'm guessing that the number in your case has simply not updated. You can force an update e.g., by moving the blue cursor on the image.
November 19, 2020 at 02:17 pm - Permalink
In reply to As you have seen,… by Igor
yu.zhangYes, I did move the blue cursor. And I can confirm that the line profile plot was always a single pixel (0 width) profile neglecting the setting of profile width. So it is not a problem of delayed update.
November 20, 2020 at 04:23 am - Permalink
I suggest you address this to support@wavemetrics.com. Otherwise, you can try the following:
with the Line Profile panel open click in the Profile Mode menu and choose Horizontal. Then choose Vertical. At this point the center and the width parameters should change range. If they do not you discovered a bug and it would be helpful for us if you sent an experiment that contained the image and the WMPrivate data folder.
November 20, 2020 at 08:16 am - Permalink
In reply to I suggest you address this… by Igor
yu.zhangHi,
Switch of horizontal and vertical modes didn't give a right profile plot.
I made a very simple test image with only a diagonal line to display this in a simple way. From the width of the spike, one can tell the profile plot is from a single pixel wide slice or a multi-pixel wide slice. I can confirm that the profile plot is always a single pixel plot, whenever moving the blue cursor, changing the profile width, or switching from hor. back to ver., provided the x dimension step (DimDelta) is smaller than 1 (I set it 0.001 with 1000 points in this example.).
In summary, the line profile program takes ""1+2*width" as number of pixels to calculate the profile plot, but not the "1+2*width/DimDelta" as mentioned in the tooltips. But the two blue vertical markers marks the correct range still.
I thank you for the kind help and suggestion, and will let support@wavemetrics.com know this.
Cheers,
Y
November 20, 2020 at 09:10 am - Permalink