Statistical significance analysis


Hi all,
I have a short question regarding the best approach to perform a statistical significance analysis for time-dependent data. I have performed force-field molecular dynamics simulations for two proteins and I would like to investigate whether their RMSD-Ca vs time profiles are statistically significant. I know that there are numerous different approaches to do this and different people would perhaps employ different approaches, but I would appreciate if you could share your thoughts for this one as well. I was thinking to perform a parametric comparison applying 1-way ANOVA followed by Tukey's test as a post-hoc evaluation. Have you ever done this for time series data? If not, any suggestions?
Many thanks,
Christos
If you have a reasonable model for the time dependence (double exponential?) you might be able to compare fit coefficients using some sort of F test.
March 8, 2021 at 10:28 am - Permalink
Thanks a lot! I have not tried this (sounds reasonable); my main concern is that I will have trouble convincing people in publications why I used a double exp. in this sort of data analysis which does not have a direct physical meaning (it has a mathematical meaning though as it is a time-dependent quantity).
Thanks,
I will try it..
March 8, 2021 at 11:10 am - Permalink
Yes, I agree that fitting to a model pulled out of thin air might be problematic. However, as a software engineer I get to suggest things and leave the justification to you :)
It does seem like there should be some sort of test that, hmm..., is applied to sum(y1_i - y2_i). Or something.
March 8, 2021 at 11:45 am - Permalink
Thanks Johnweeks!
I will write back here what I ended up doing..!
March 8, 2021 at 12:06 pm - Permalink
You have two data sets R1 and R2 (where R2 > R1). I might consider one of these two approaches:
Method 1
* Smooth the data to obtain a best-fit curves S1 and S2
* Determine the difference between the smoothed curve and the raw data Dj = Sj - Rj
* Determine the standard uncertainty of each Dj --> uj (you are basically determining the noise level in the signal)
* Calculate a "region of statistical overlap" function O = (S2 - f*abs(u2)) > (S1 + f*abs(u1)) ? 0 : 1
In this, f is 1, 2, or 3 to denote the various sigma levels of overlap. You can modify the "off/on" switch behavior by changing the logic of the test that is used to signify "statistical overlap".
Method 2
* Fit the data to a basic analytical function that resolves the salient features
* Compare the overlap of the fitting coefficients
March 8, 2021 at 12:38 pm - Permalink
jjweimer,
thanks a lot for your response. Clearly Method 2 seems to be more straight forward. Will try it and let you know how it goes..
Best
Chris
March 8, 2021 at 06:09 pm - Permalink
You can also fit the data to a function and use the resultant curves as S1 and S2. It seems to me to depend on whether you are trying to distinguish whether the two data sets have significantly different modeling parameters or whether the two data sets are significantly different from each other in behavior regardless of the model.
As with any analytical model, it helps to have some physical insights to tie down the parameters.
I can for example easily see "normalizing" both curves to their maximum values and thereby determining that the two cases are not statistically different in their underlying formation model but that one yields a higher value than the other.
Also, do you have any way to make the plots on a dimensionless scale. Do you have a characteristic relaxation or interaction time constant to scale time? Do you have a characteristic distance to scale the ordinate. You make have more insights from that on how to create a model for a dimensionless plot than a dimensioned one.
March 8, 2021 at 08:39 pm - Permalink
jjweimer,
Thanks a lot for your suggestions!
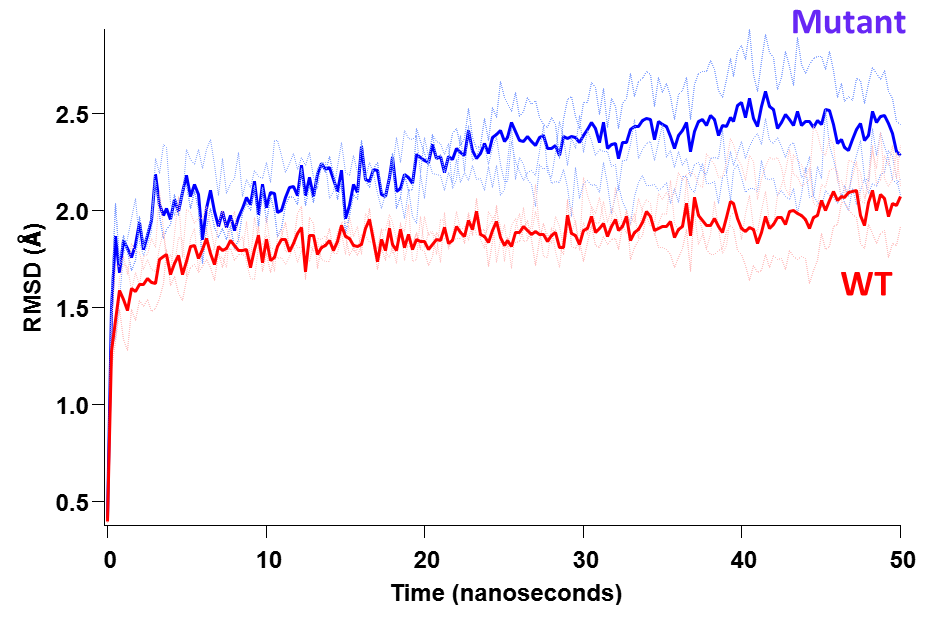
what I am trying to do is to distinguish whether the two datasets are significantly different from each other regardless of the model. I am not particularly interested in the modeling parameters simply because I cannot attribute & assign, say a double exponential model (from a mathematical standpoint) to any physical meaning for my system and this may be risky. What I studied here is the behavior of 2 proteins (WT and mutant) by means of force-field molecular dynamics simulations and the plot I show above represents the structural
"destabilization" as a function of simulation time (50 nanoseconds here). So, I understand that from a mathematical perspective one can fit these datasets to an analytical model; in fact I tried a double exponential fit and it looks very good for both of the traces. Then by comparing the parameters of the analytical fit, one can determine the difference of these two fits.
However, one may ask, what does this double exp. mean for this system? Is there an initial rate of increase of this RMSD followed by a second slower exponent? And if yes, what does this mean for the protein? This is why I would like to stay away from fitting to analytical models and just compare & distinguish the datasets from each other.
If I had an actual physical model I could build, I could probably try to fit this dat aby numerical integration as well.
In any case, I think that just distinguishing the two datasets from each other, an approach including ANOVA followed by a post-hoc test like Tukey's test should be sufficient to provide an answer of that nature..
Many thanks!
March 9, 2021 at 06:52 am - Permalink
I'm not an expert in this area and when I tried to understand the question better I came across https://www.ncbi.nlm.nih.gov/pmc/articles/PMC4321859/ which said:
"The most popular measure of the first class, the global RMSD, is shown to be the least representative of the degree of structural similarity because it is dominated by the largest error."
If I look at your question without any background my first response is in agreement with JJWeimer, i.e., you find a model, fit the data and perform the statistical comparison on the basis of the resulting fit parameters. I don't think that the precise model is very important in this case as long as it provides a "good" representation of the data. This means that you need to know enough about the process to determine what constitutes a "good" fit. As an extreme example, suppose the physics is actually in the frequency of oscillations (of what appears like noise in your data). In this case the functional form of the offset and the actual curve are completely unimportant and at the same time smoothing the data would be counter-productive.
March 9, 2021 at 09:47 am - Permalink
Thank you Igor for your message. I will attempt to compare the data in the way that jjweimer and you suggested and see what I get. I fully agree with this approach and with the fact that the fitting model-physical meaning link may not be very important. I am just trying to avoid pitfalls that may arise from other peers and reviewers in my field.
Thank you both!
March 9, 2021 at 12:18 pm - Permalink
Perhaps also to add to this again. When an analytical model does not have a true physical interpretation, it must have the fewest number of parameters (degrees of freedom) as possible that sufficiently fit distinct characteristics in the data. No more. Alternatively said, suppose you find a model with one parameter that fits the data. Suppose that you now add a parameter. What metric will you use to state that the additional uncertainty to the meaning of the model added by using a second parameter is surpassed by the improved confidence in the ability to fit the data?
I am vaguely reminded of an advertisement in .. Physics Today or Analytical Chemistry I believe ... many years (decades) ago for a program that I think was called PeakFit (I don't think it was Origin). To paraphrase by gross illustration: There was Dr. Jones and Dr. Smith. Both had the same two peak spectrum on their proposal. Dr. Jones used PeakFit to obtain four peaks to fit the curve. Dr. Smith used some competitor program (not Igor of course) and only had two peaks. Dr. Jones won the grant proposal.
To which I (cynically) had to say to myself ... Well of course, Dr. Jones has absolutely no clue what physical meaning to give to the two additional peaks, but sure, the agency had to give him the money because he did all that fancy extra work to make the prettier looking curve fit.
Your data clearly has two characteristic time domains, a fast change over a short time followed by a slow change over a long time. Use only two parameters. No more.
How do you justify a non-physical model to your doubting, naive, or ill-informed community of colleagues? I do not know. I truly think that you have to invert this question first. I am still not sure what "statistically different" really is supposed to mean to you. Does it mean the time to reach a certain size? Does it mean the rate at a certain time? Does it mean the size at a certain time? I think when you do not get a handle on these questions first, any non-physical model that you use will only make you appear to be guessing (spitting in the wind we might say). So, your non-physical model not only must have the fewest parameters that are sufficient, it also must have the most appropriate analytical form possible to target your hypothesis and exclude any other hypotheses. Here, as one less informed about such meta-thinking, I must leave the discussion to the possible experts in your field.
Finally, I return again to a previous question. Do you have ANY way to scale your data in a dimensionless manner? What parameter could you use from the MC simulation to scale (normalize) the RMSD? Perhaps the tightly-collapsed (crystalline T = 0K) size of the protein? Perhaps the steady-state (infinite time) radius of gyration of the protein? Correspondingly, what characteristic time constants play a role in the MC simulation for the time evolution? Perhaps the jump time of a particular residue? And hopefully for the time constant, you can truly give TWO characteristic time constants of some physical meaning, one for a rapid expansion (akin to an adiabatic, irreversible, free-expansion process) and one for a slow expansion step (akin to a reversible, isothermal expansion process).
When you can at least state from physical arguments that any model must have two characteristic time domains, you are far better positioned to argue not just from the shape of the curve but also from the physics of the expansion process itself that you must use a (non-physical) analytical function that has two parameters controlling time dependence. When you can also non-dimensionalize (normalize) the RMSD curves by a characteristic size constant for each case, you will also be able to remove ambiguity about how differences in your non-physical model do or do not contribute to the absolute size of each curve.
March 9, 2021 at 06:12 pm - Permalink
Thank you jjweimer for this lengthy and informative response. Thanks a lot for your time; agree with all your points!
March 10, 2021 at 06:48 am - Permalink
I have to agree- nice bit there, Jeff! You must have a sideline teaching statistics to undergrads :)
And you are right to focus on trying to figure out exactly what aspect of the curves is to be compared. When I suggested a double exponential fit, it was a result of my practiced curve fitter eye telling me that would probably match the shape of the curves pretty well. Naturally, a software engineer who is a former rock mechanics researcher doesn't have a clue what the curves mean! But indeed, you might want to compare time constants, or the "steady state" level (which isn't evident in the graph provided), or some other measure of... something.
March 10, 2021 at 01:04 pm - Permalink